


In the face of Federal Reserve Chair Kevin Warsh’s decision to choose violence by taking the “max hawkish” stance, we saw investors quickly buy the dip. In our opinion at Cornerstone, the buys were arguably for the right reason.
So, today we want to analyze why we believe the Fed’s max hawkish stance is a bullish setup for equities as well as six independent data signals converging to paint a positive forward outlook for the remainder of 2026.

There are multiple reasons the Fed decision is bullish:
- A hawkish Fed equals a hard-to-see scenario of anything “more hawkish” (i.e., full risk price).
- Clear incrementally dovish economic data points ahead
- Since the rate decision, Fed governors walked back some of the hawkishness, which should continue.
- On Sept. 30, the new core personal consumption expenditures methodology comes into effect, which should see the current 3.4% PCE revised downward by about 40 basis points.
- We expect the Oct. 3 report of September jobs forecast data to be soft.
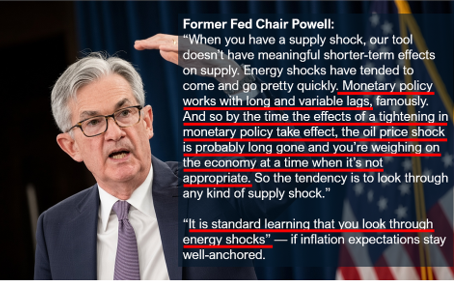
Core PCE could be the most important factor. Policymakers clearly aren’t leaving inflation to fall on its own. But there will be significant downward pressure as the initial energy shock falls off and the new PCE methodology begins. These converging factors indicate cooling inflation ahead.
That’s why last week we said hiking rates was a mistake – monetary policy has long and variable lags. The change in the federal funds rate last week will take six months to show impact on inflation (i.e., March 2027).
If core PCE falls 100 basis points between now and March, it won’t be because of the recent hike, making the hike an unnecessary policy error.
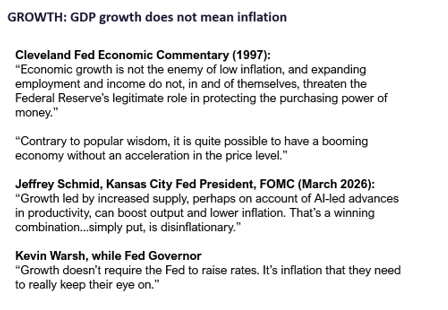
If the core PCE reading begins with a two in early 2027, economists and pundits will be proven impatient. It’s another clear example that continued GDP growth is not a leading indicator of further inflation:
That's why this is a bullish setup.
- Underlying fundamentals remain historically strong.
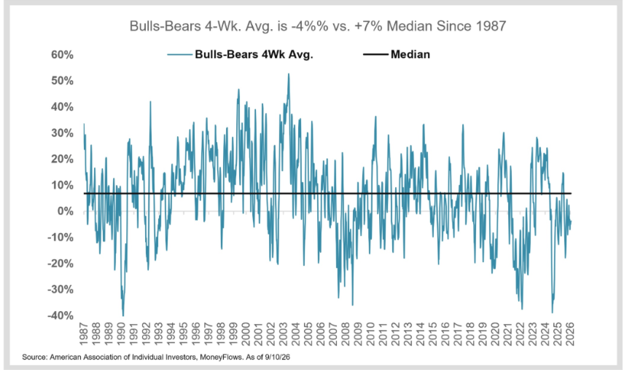
- Investor sentiment remains extraordinarily cautious (a significant contrarian indicator)
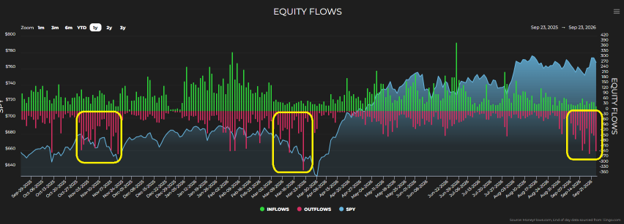
- The seasonal and rate-hike-caused washout underneath the surface is eerily similar to the previous two high outflow periods over the last year that immediately preceded face-ripping rallies.
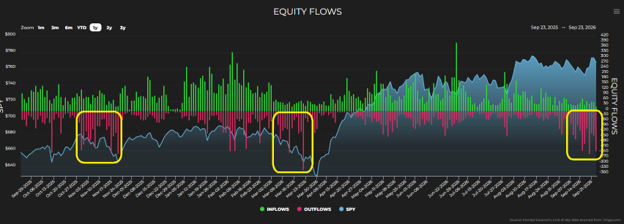
These reasons, along with the fact that the upcoming incremental data will be dovish, set the stage to fuel further upside.
A Blessing of Sorts
Now on to the more fun type of data.
In preparing for next earnings season, from a 10,000-foot view it seems many investors see through the intraday volatility as major indices are still within shouting distance of their all-time highs.
But underneath the surface tells us a very different story. It’s simultaneously bullish through the remainder of 2026 while also showing underlying damage to equity markets. And it’s right on schedule.
It’s also a blessing of sorts. Most investors aren’t actually “feeling” the pain that they could be, considering the underlying seasonal weakness right underneath our noses.
Let’s start with giving a big shout out to our friends at MoneyFlows for their help in this analysis. It shows how we’ve basically been experiencing the midterm washout underneath the surface, but most investors focused on the surface indices haven’t noticed.
This matters because the “max hawkish” bullish Fed view above is backed up by this data.
Bears Awake
Drilling down to the micro level to analyze every individual public stock in the universe that we evaluate (i.e.- over 5,000), nearly half of publicly traded companies are down 20% or more from their 52-week highs. By definition, that is a bear market for each of those stocks.
Like the black bears roaming California, the seasonal weakness bear has been found awake.

The average stock is 19% off its high and the damage underneath the surface shows a clear staircase where larger companies have fallen less while smaller companies have been hit harder.
In terms of median returns:
- Mega-caps are down 13% from highs with 28% of them in bear market territory.
- Large-cap stocks are down 15%, with 38% of them in a bear market.
- Mid-caps are down 18% with almost half being in a bear market.
- Small-caps are off 20% with 50% of them in bear market territory.
- Micro-caps are down 31% with 58% in bear territory.
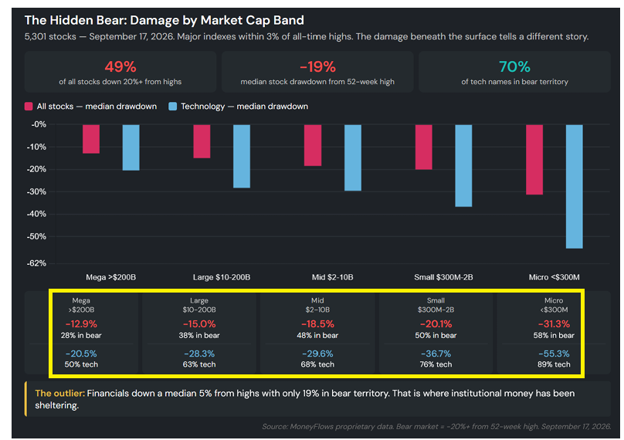
Looking just at technology stocks, the data is even worse. Currently, 70% of all tech names are in a bear market with the median stock down 34% from their 52-week highs.
Whether markets are good, bad, or indifferent, what matters to us from an analytical standpoint more than anything is that the inputs and outputs make sense. In this case, the data and timing clearly come together in a manner that makes clear, objective sense.
Two fundamentals predict damage: profitability and debt. Profitability matters most. It’s exemplified in the fact that profitable micro-cap stocks are down an average 11% from their high whereas unprofitable micro caps are down 52% from their highs:
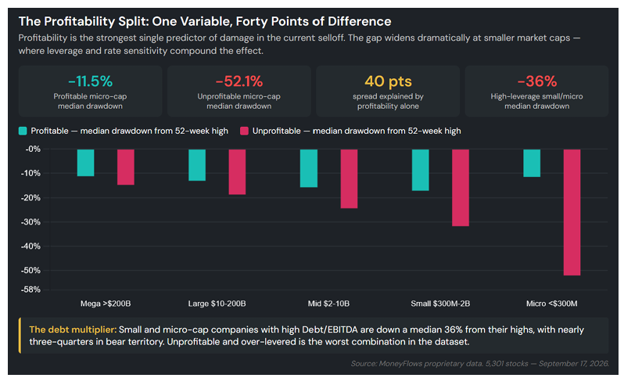
That's a 42-point spread driven by whether the business makes money or not. Debt then compounds the difference. Highly leveraged small- and micro-cap companies are currently down a median 36%, with nearly three quarters of them being in bear territory.
Rising rates hit smaller companies harder because their debt becomes more expensive. Understanding this dynamic begins to explain why institutional money has been hiding in energy, health care, and financial stocks while other remaining sectors have quietly been suffering.
With this underlying pressure on equities, it makes sense why 12 of the 17 trading sessions since Aug. 31 produced 100 or more institutional outflows each:
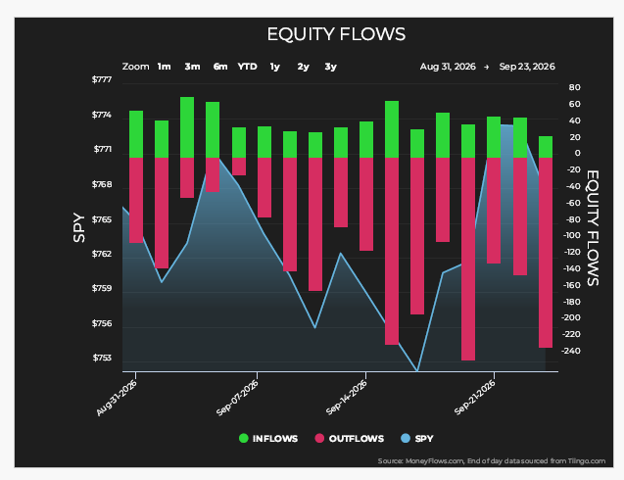
That's the biggest cluster of extreme selling since the March 2026 capitulation and a perfect time for this chart to reappear – look what happens after the washouts in late 2025 and March:
Bulls Tend to Run After the Storm
In March there was a similar run of outflows that ran 12 sessions before the bottom. A month later the S&P 500 was 9% higher.
Furthermore, there are eerily similar data trends in MoneyFlows’ Big Money Index (BMI) over the last year:
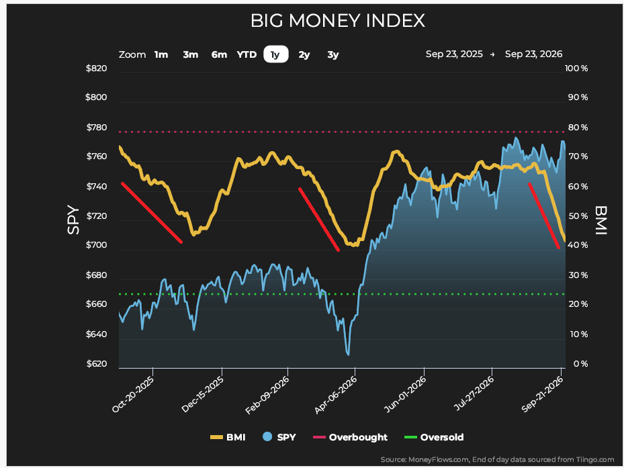
Looking back to March, the BMI fell from 65% to 42%. Currently, the BMI dropped from 69% to 43.1%, as of this writing. The exact same action happened in October 2025 as well.
Some may say two previous instances isn’t a big enough sample to be representative. Fair point. Looking back to 1990, there were 765 sessions with 100 or more institutional outflows (only 8.3% of all trading days in 36 years). The returns afterward are solid across all time horizons:
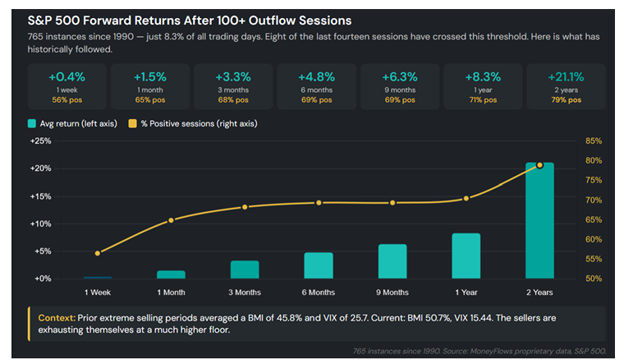
For those with patience, the two-year average return is 21.1% with a 79% win rate. History shows underlying equity pain is temporary and recovery follows.
History also shows us what recovers quickest. Across nine midterm cycles since 1990, the Nasdaq 100 averaged 37.4% in the year following election day, which handily beat the other indices:
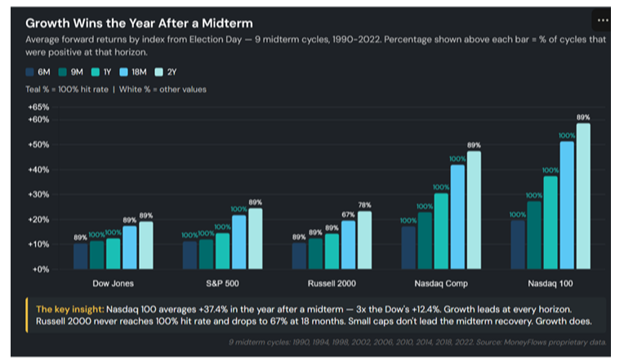
Growth stocks led the recovery every time and it's not even close.
Where are we in the timeline? Let’s look through 36 years of daily data to find out and see which weeks carry the most weight in midterm years.
September weeks three and four have been the weakest historically with negative average daily returns and less than 47% of results being positive. This is where we are now.
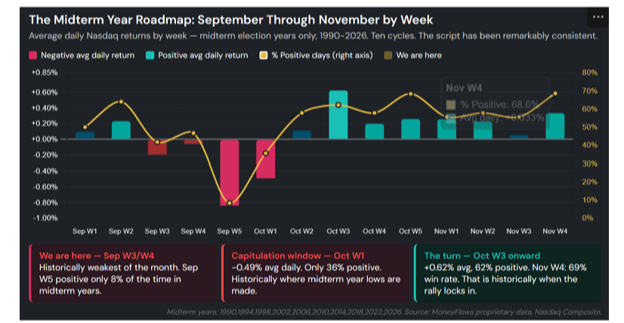
Furthermore, October's first week is historically the worst of that month with a 0.49% average daily drop and positive outcomes occurring only 36% of the time. Typically, that is where the midterm lows are made. Then the turn happens fast and carries into November, when the rally starts.
Knowing these underlying fundamentals and historical bullish signals, what about credit markets? Well, they also support the fundamental strength and bullish outlook.
Credit spreads measure the premium companies pay above comparable Treasury yields to borrow money. They can act as an early warning signal and help separate signal from noise. When they widen, it indicates underlying economic weakness.
But despite all the macro noise, investment-grade credit spreads are currently near record low levels at only 81 basis points above Treasurys:
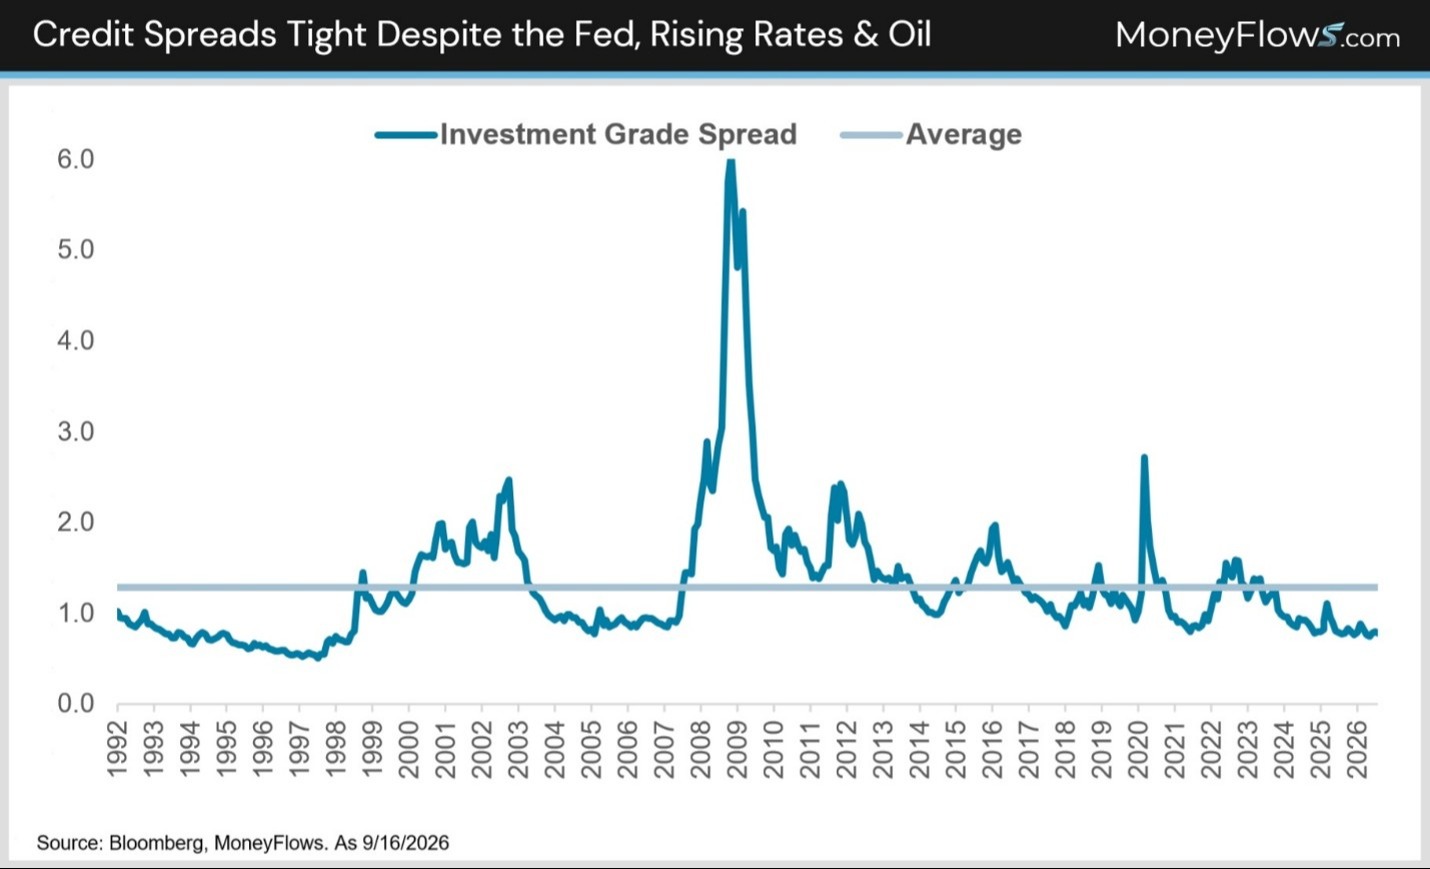
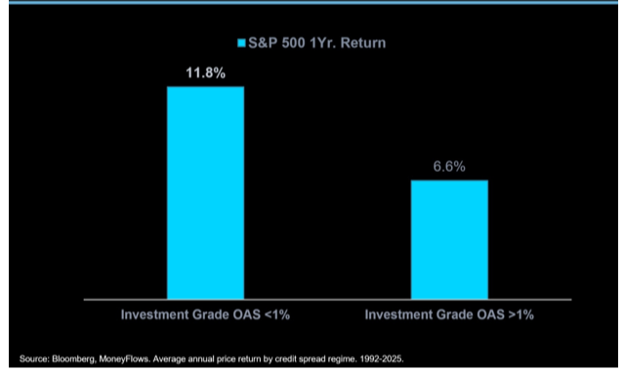
That's well below the long-term average of 129 basis points. Historically, stocks outperform when credit spreads are under 1%, which makes sense because tight spreads reflect bond investors' confidence in the health of corporate America.
Since 1989, the S&P 500 has gained almost 12% in the 12 months following sub 1% investment grade credit spread readings versus only 6.6% average increases when spreads are above 1%:
Let's dig one level deeper to confirm what the credit markets are signaling for stocks going forward. To do this, let's look at the high yield credit market.
Specifically, let’s review the relationship between equity stress (i.e., the CBOE Volatility Index (VIX)) and credit stress (i.e., high yield spreads). The bond market is often considered the “smarter” and unemotional market. So, when the bond market fails to weaken alongside a rising VIX, it often signals that equity selling is overdone and emotionally driven.
Analyzing this relationship during the latest bout of equity risk aversion, we can see the VIX rise outpaced credit spreads:
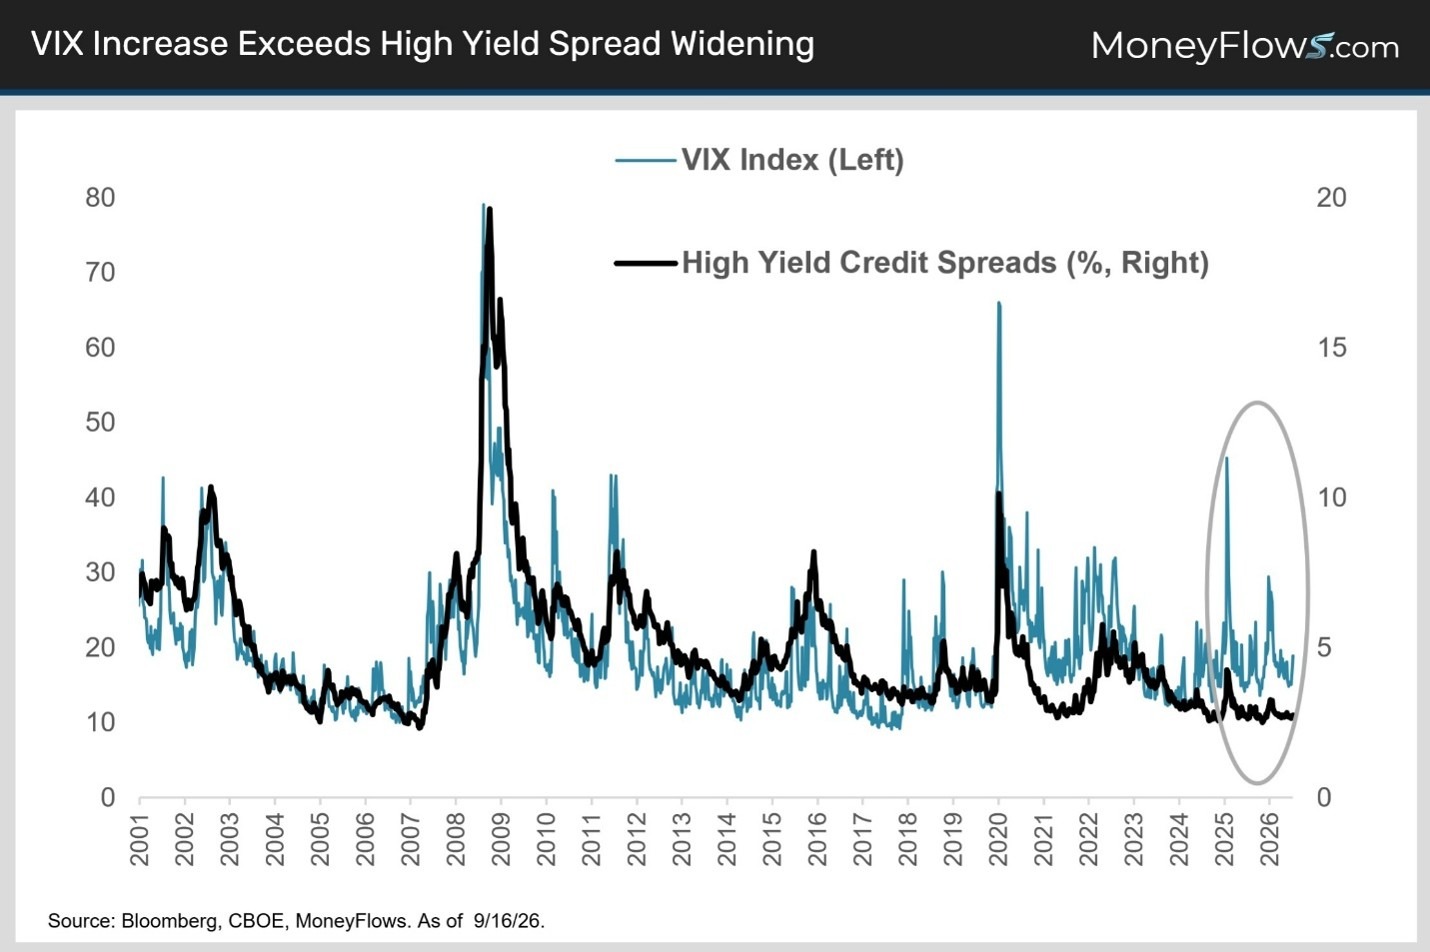
A similar inversion occurred back in April 2025 and again in March 2026, both of which turned out to be epic buying opportunities.
Since 1990, the S&P 500 averaged 15% gains the year following these similar relative emotional equity panics like we are seeing now.
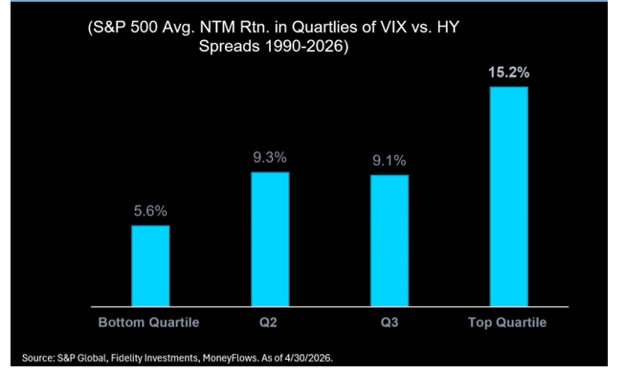
The credit markets are telling us that the macro is better than the popular crowd narrative thinks.
Tying this all together, what picture does this begin to paint for the outlook for the rest of the year? Forced to answer that question, we believe there are six independent data signals converging that provide the foundational support for the bullish setup for the remainder of the year:
- The BMI's quick drop to the low 40s at a similar pace to where prior corrections bottomed over the past year.
- Three decades tells us that October's first week is the worst of the midterm year and likely when the lows are put in.
- The current cluster of 100+ outflow days is at 12 sessions, which is the same cluster we saw back in March before the market bottomed.
- Bond market price spreads tell us there's currently high confidence in the health of corporate America.
- The VIX’s moves signal the recent equity selling is rooted in emotions rather than objective facts.
- Earnings. Earnings. Earnings.

*Links to third-party websites are being provided for informational purposes only. CoreCap is not affiliated with and does not endorse, authorize, or sponsor any of the listed websites or their respective sponsors. CoreCap is not responsible for the content of any third-party website or the collection or use of information regarding any websites users and/or members.
*Past performance does not guarantee future results.
Securities sold through CoreCap Investments, LLC. Advisory services offered by CoreCap Advisors, LLC. Cornerstone Financial and CoreCap are separate and unaffiliated entities.