


Just over six months into 2026, while many investors feelings may disagree, the headline numbers are deceptively calm. But the first half of the year was strong pretty much across the board.
Every major index outperformed initial expectations:
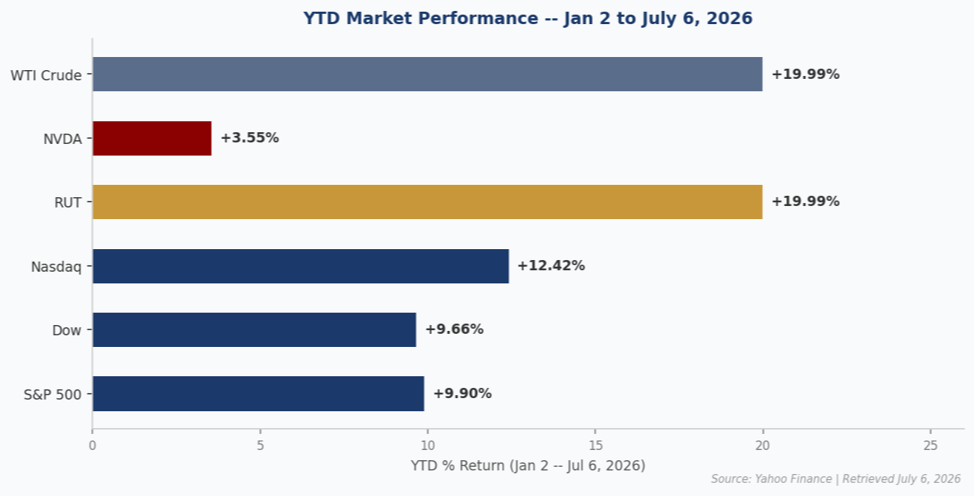
Taken together from a macro perspective, this begins to paint a picture that the equities market overall has actually been strengthening and broadening.
With that in mind, today we’ll focus on the second half of the year. We’ll analyze current market expectations and objective data to provide clarity on what to expect over the next six months.
Let’s keep some things in mind:
1. The ISM above 50 after three years being below 50, which historically signals accelerating earnings growth.
2. Earnings accelerating at a pace implying significant upside through the end of 2027 (more on this later).
3. Oil prices falling to pre-war levels, setting the stage for overall inflation to fall in the second half.
4. The combination of the current “hawkish” bond market and the newly “dynamic” Federal Reserve create a positive second half tailwind.
5. The 55% year-over-year rise in margin debt (see last week’s blog for details).
6. Fund managers trailing benchmarks this year by the widest margin in five years (these fund managers must buy dips in order to play “catch up”, helping provide forced equity market support).
Most importantly, we now turn to the start of earnings season. Because as always, it comes down to earnings, earnings, earnings.
For the second straight quarter, analysts and companies are significantly more optimistic than normal in their earnings outlooks. In terms of estimate revisions for S&P 500 companies, analysts increased their earnings forecasts on a per-share basis for the second quarter by 3.4%:
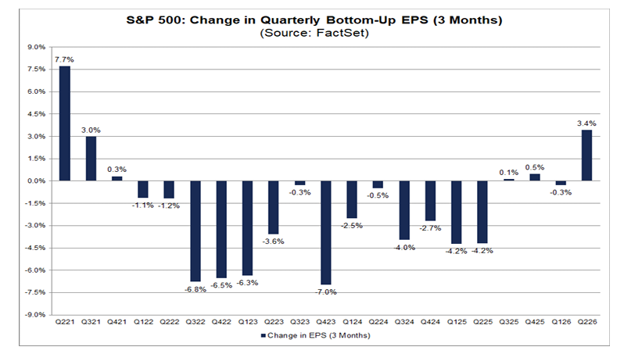
This is interesting because analysts usually lower their earnings estimates. For example, over the past five years, earnings expectations have fallen by 2%, on average during this time period. Over the past 10 years, it’s 2.7%.
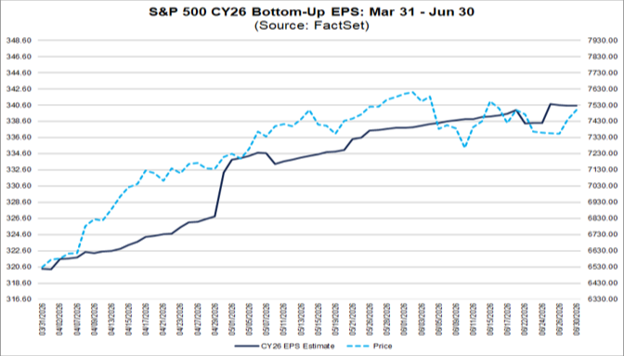
But EPS expectations not only increased for Q2, they’re also up to 6.3% for the whole year:
We’re seeing significant, and accelerating, optimism from the companies themselves too. For Q2, 111 companies have issued EPS guidance, with 63 issuing positive guidance:
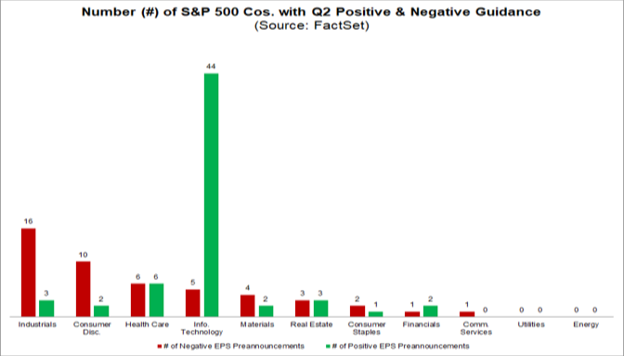
For perspective, the five-year average of companies issuing positive EPS guidance is 44 and the 10-year average is 41. That’s 57% of firms issuing positive guidance, which beats the five- and 10-year average of 41%.
Upward revisions to earnings estimates by analysts and positive EPS guidance by companies pushed the estimated earnings growth rate for Q2 significantly higher. As of the end of June, the S&P 500 is now expected to report year-over-year earnings growth of 23.3% compared to the initial estimated earnings growth rate of 18.8% on March 31:
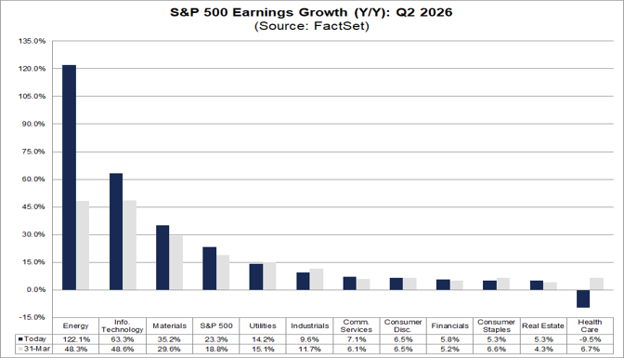
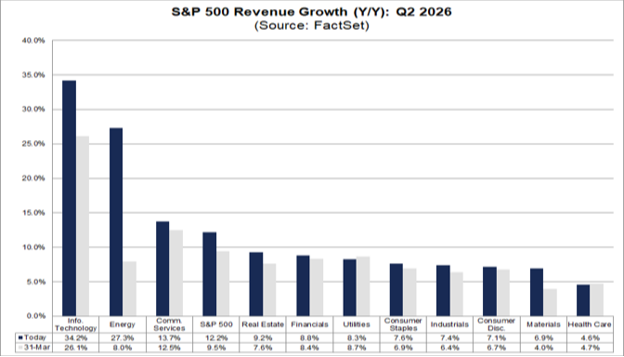
If that happens, it will be the second consecutive quarter of earnings growth above 20%. Importantly, this earnings growth rate is not merely financial engineering, but a product of continued robust revenue growth.
As of the end of June, analysts expect revenue growth of 12.2% versus 9.5% on March 31:
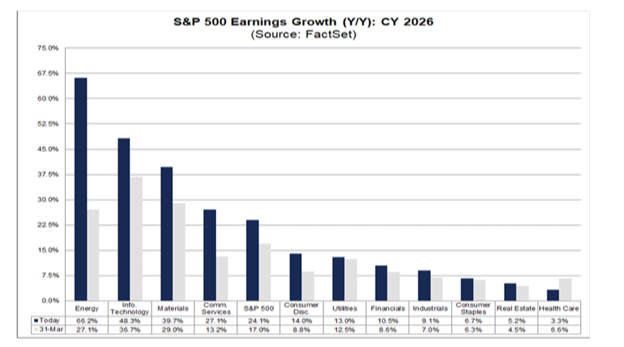
From an earnings expectations perspective, we’ve noted throughout the year how this level of earnings strength isn’t expected to slow. For Q3 and Q4 2026, analysts are now calling for earnings growth rates of 26.8% and 24.4%, respectively. If achieved, it would be the first time, since FactSet began recording this data, all four calendar quarters had earnings growth rates over 20%.
The 2026 analyst earnings growth rate expectation is 24.1%, which is incredible:
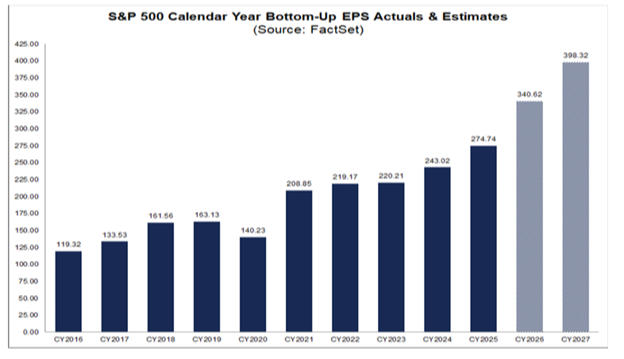
And looking past 2026, estimates continue to indicate further increasing EPS growth through 2027:
To us at Cornerstone, the most important takeaway when analyzing the current earnings growth previews is the fact that this level of earnings growth is significantly outpacing current equity market price growth. It’s reflected in the recent quick drop in valuations:
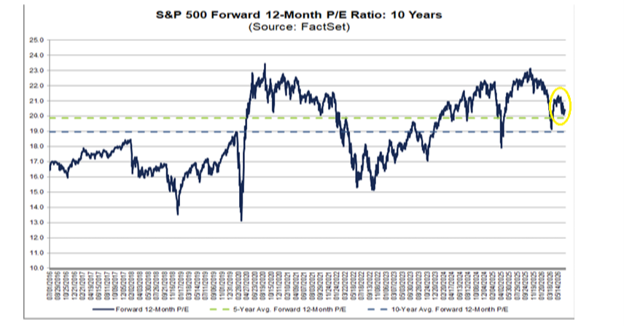
It’s clear data that contradicts any narrative about current equity markets being overvalued or inflated. The historically strong earnings growth isn’t the only foundational data support for a healthy market going forward.
Specifically, healthy rotation and market broadening are hallmarks of great bull markets. We’re amid a clear market broadening environment now as investors shift out of previously popular core names and into prior benchwarmers.
This rotation is accelerating, especially into areas like dividend stocks and small-cap stocks. It’s why market mechanics and stock picking in 2026 have mattered more than ever.
For perspective, the Magnificent 7 stocks’ weighting alone in the S&P 500 is 31%. When they underperform as they have been, huge amounts of liquidity need a new home.
There’s been a clear rotation this year out of big tech stocks, which has helped other asset classes like small-caps, mid-caps, equal weight S&P 500, dividend stocks, value stocks, and so on:
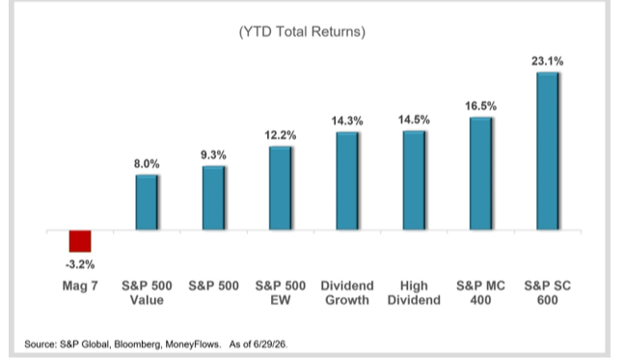
This is evidence of the shift in investor preference we’ve discussed all year. It supports a discerning and fundamental based trading environment.
This rotation and breadth isn’t merely supported by returns, though. Institutional money flows support it too:
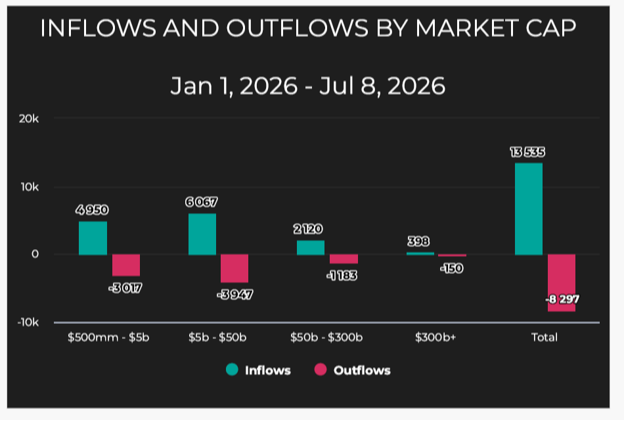
We expect this discerning, bifurcated investing environment to continue rewarding companies with strong fundamentals, especially the immediate recipients of AI monetization and corporate spending.
This action makes sense from a timing perspective, because as we’ve said numerous times, the bull market is ongoing but could get bumpy as midterm elections near. The rotation we're seeing into dividend stocks is appropriate because dividends have historically acted as a shock absorber when markets turn choppy.
Thanks to the power of the compounding nature of dividends, over time they’ve provided 36% of the S&P 500’s total average return:
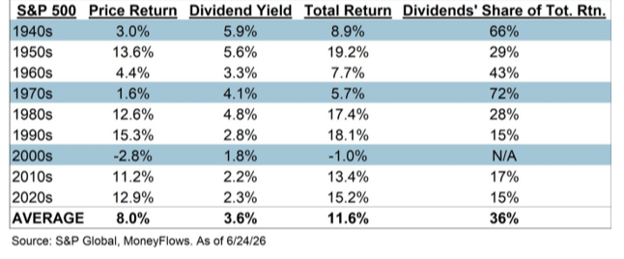
Put another way, stocks returned 8% a year without dividends versus 11.6% with reinvested payouts. That additional 3.6% per year is the shock absorber.
This dynamic also begins to explain why dividend stocks historically offer less risk with more reward. Companies that regularly return capital via dividends reflect a well-established business with a strong market footprint.
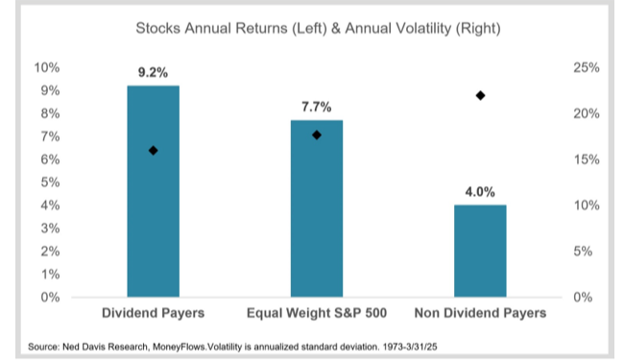
A study by Ned Davis Research showed that since 1973, dividend paying companies significantly outperform non-dividend payers while also being notably less volatile:
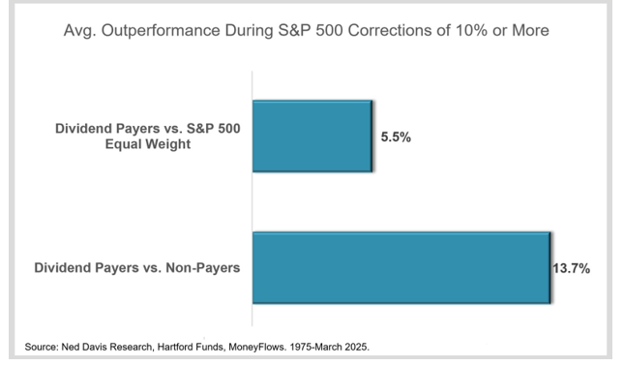
Lastly, dividend paying stocks are significantly more resilient in high volatility markets. When S&P 500 drawdowns are 10% or more, dividend payers perform 13.7% better than non-dividend payers:
This dynamic played out earlier this year in Q1. Specifically, we saw this in our own proprietary CFS Dividend Growth portfolio which increased 6.6% in Q1 2026 while the S&P 500 fell -4.3% in the midst of early year inflation and war uncertainty.
There’s a powerful combination of accelerating earnings and a fundamentally strong broadening rotation within the market. It’s the clear foundational support needed to believe in the long term viability of the current bull market moving forward.
*Links to third-party websites are being provided for informational purposes only. CoreCap is not affiliated with and does not endorse, authorize, or sponsor any of the listed websites or their respective sponsors. CoreCap is not responsible for the content of any third-party website or the collection or use of information regarding any websites users and/or members.
*Past performance does not guarantee future results.
*Investing involves risk and you may incur a profit or loss regardless of strategy selected.
Securities sold through CoreCap Investments, LLC. Advisory services offered by CoreCap Advisors, LLC. Cornerstone Financial and CoreCap are separate and unaffiliated entities.