


We’re now into the heart of the dog days of August as traders and the rest of Wall Street sip espresso martinis and glasses of champagne on the beaches of Nantucket, the Hamptons, Miami, Martha’s Vineyard, and the like.
As usual during these periods of low volume and minimal fundamental data, we at Cornerstone and everyone else are experiencing market-affected headlines and emotion-laden decisions.

But before we touch on this week's popular, emotional narrative, we’d be remiss not to address the historically strong earnings season one last time. For the Seinfeld fans out there, the S&P 500 earnings are real, and they’re spectacular:
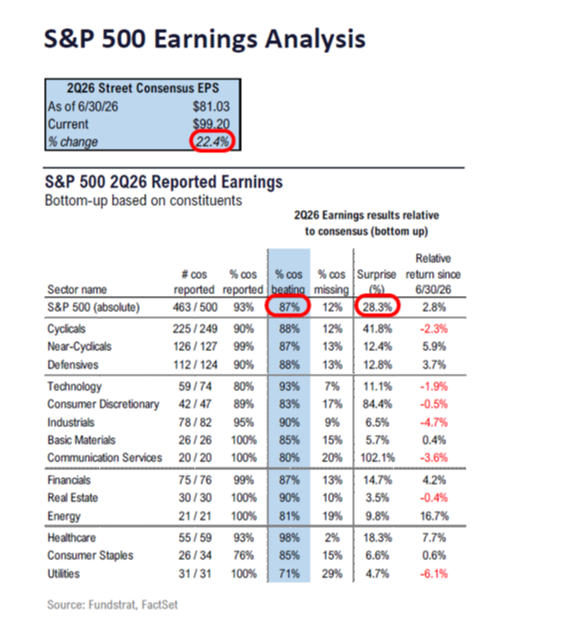
We’ve spent weeks pointing out the strength of these results. The latest data shows we’ll very likely complete this earnings season with over 50% year-over-year earnings growth:
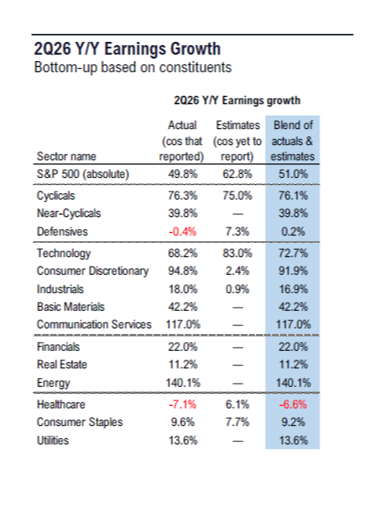
That’s absolutely astounding.
With the good news out of the way, let’s focus on the current negativity. As the fundamental data dried up recently, the news turned its attention to increasing long-term global yields. Most specifically, the U.S. 30-year Treasury increased somewhat unexpectedly.
In the face of these rising yields, last week the Department of the Treasury began an effort to push back by saying it will “at least double” the amount of 10-, 20-, and 30-year Treasury bonds it will buy back.
But rising long-term rates aren’t unique to the U.S.:
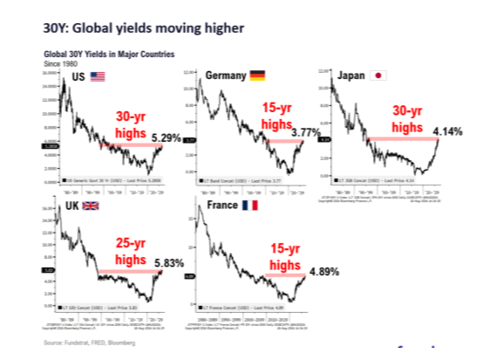
Rising rates have been uniform across most of the developed world.
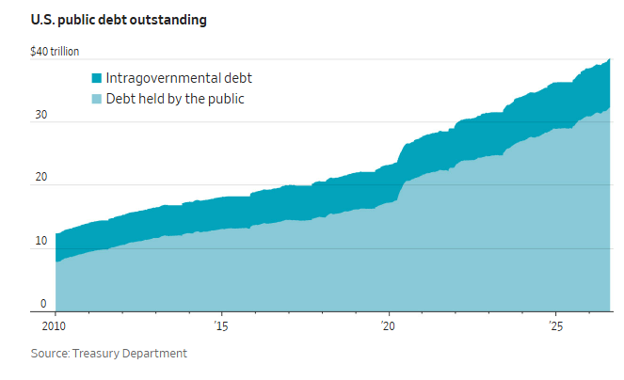
To dissect this, as we have in the past, let’s first acknowledge long-term U.S. debt is absolutely a legitimate and real concern, having recently surpassed $40 trillion.
There’s been some misinformation regarding what's going on with yields and the reasons for the unease. The argument saying fears over instability in the Middle East and the seeming correlation between tanker traffic in the Strait of Hormuz and the 10-year Treasury while at the same using the 30-year yield to cast doubt is illogical.
What’s happening in the Middle East and with the 10-year Treasury are directly related to current inflation fears.
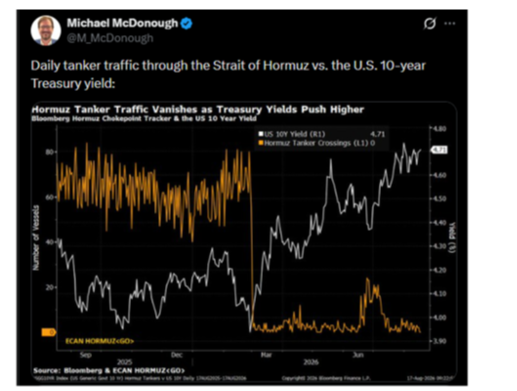
Those data points have no correlation to 30-year Treasury yields, which are directly tied to the long-term viability of the U.S. to pay interest and principal on long-term debt obligations.
People are using both data points to make the same argument even though the data doesn’t relate. The connection seems to be more out of convenience to drive emotional decision making during the heart of the summer doldrums, when low volumes, a lack of traders, and a lack of fundamental data are the norm.
In truth, the 30-year Treasury isn’t a true reflection of the stock market because the stock market's not looking out that far. That's why the two-year and 10-year Treasurys are used instead.
But people are making the argument that the rise in the 30-year Treasury is what's negatively affecting the stock market. It’s never been a measure of stock market health. It doesn't make sense to artificially connect two completely separate and distinct yield-based data points that have nothing to actually do with each other.
So, people are playing both sides of the coin because it’s convenient.

Yes, the $40 trillion debt is a real long-term issue. But it’s disingenuous to use it as a leading indicator for short- and intermediate-term equity market issues. There is no historical precedent for using the 30-year Treasury to establish a fair value for equities.
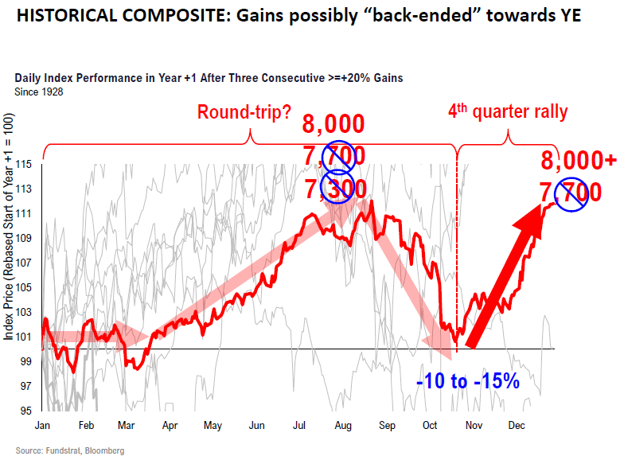
Really though, none of this should be surprising since it’s a midterm election year and we’re right in the thick of “uncertainty season.” We’ve said all along to expect market weakness during the late summer leading into the historic election season before a fourth quarter rally.
The only difference today is the market overshot our initial projections for the first three quarters of the year. This is extraordinarily bullish and makes us even more confident with our overall higher year-end target expectations than originally anticipated in January.
For us, the focus is on the AI infrastructure build-out thesis, day-to-day and week-to-week fundamental and money flow data, and historical cyclical data precedence that give us a glimpse into the overall health of the corporate economy and markets.
What about jobs? Weakness in the labor markets has been in the headlines.
Well, jobs reports on a month-to-month basis have never really meant anything fundamentally foundational, and yet the market moves with them. And then a month later, the data is revised.
What’s more relevant is to analyze cyclical labor market demographic data that has more historically applicable value over the short-to-intermediate corporate economy and market strength.
For the current economic cycle, we would point to the prime skilled U.S. adults labor supply instead of employment data. Let’s first understand where exactly we are in the labor supply cycle – we're beginning to enter the middle of the prime skilled adults aged 30 to 48 labor supply:
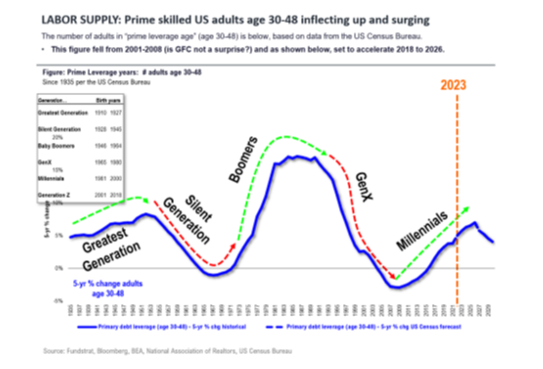
This matters because history shows how equity markets follow the adult prime labor supply cycle symbiotically. Put simply, as the prime labor supply increases, overall earnings increase. Therefore, overall spending, saving, and thus the demand side of equity markets, housing markets, and the like, all increase.
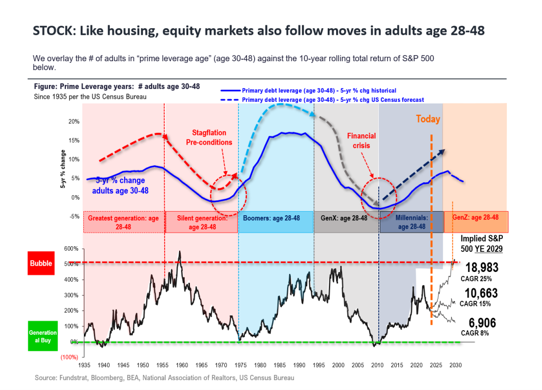
The congruence is amazing.
Sitting here today, we think the thematic AI infrastructure trade is still in its early to maybe barely middle innings. It can extend to at least somewhere around 2030.
So, how does additionally understanding labor supply strength and the millennial generation’s peak potentially affect equity markets? The current peak of this labor supply cycle is expected to be completed around 2038:
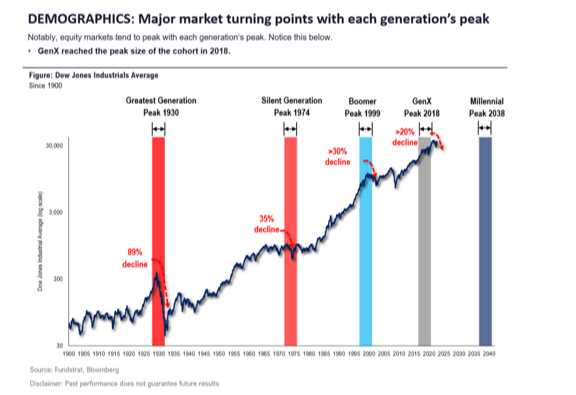
We think this provides further support for the intermediate-term bullish narrative surrounding the market and corporate economy. Those pontificating emotional, fear-driven narratives would argue our stance is nothing but contrarian. So be it.
However, let’s be clear: this is in no way a prediction without historical precedent. Using historical data back to the boomer generation’s prime labor supply cycle, if the same peak acceleration in this long-term bull market matches the previous long-term bull market trends, it’s not unreasonable to see a path to somewhere between 12,000 and 16,000 for the S&P 500 by 2029 (only a mere two-and-a-half years away):
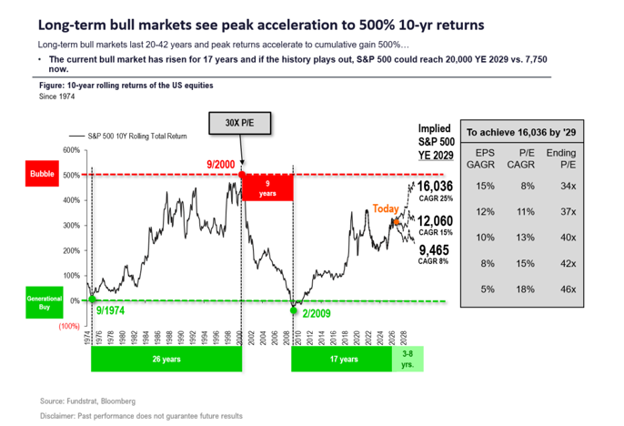
The chart above illustrates, as an example, that to achieve the 16,000 high-end target requires earnings to have a 15% compound annual growth rate (CAGR) combined with minimal P/E annual growth expansion of 8%. But just scroll back to the beginning to remind ourselves that the current fundamental data indicates that that we should experience well over 20% EPS year-over-year growth for the foreseeable future.
*Links to third-party websites are being provided for informational purposes only. CoreCap is not affiliated with and does not endorse, authorize, or sponsor any of the listed websites or their respective sponsors. CoreCap is not responsible for the content of any third-party website or the collection or use of information regarding any websites users and/or members.
*Past performance does not guarantee future results.
*Investing involves risk and you may incur a profit or loss regardless of strategy selected.
Securities sold through CoreCap Investments, LLC. Advisory services offered by CoreCap Advisors, LLC. Cornerstone Financial and CoreCap are separate and unaffiliated entities.