

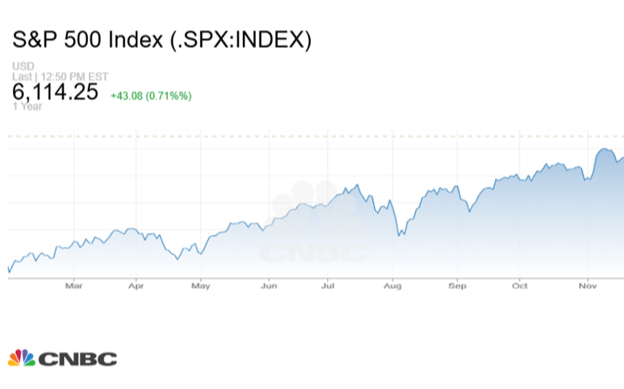
The first month of 2025 ended, inviting a good reflection point for a seemingly bipolar start to the year.
After everything that occurred in January, and all the fear mongering, the S&P 500* was up about 3.97% for the month (as of this writing):
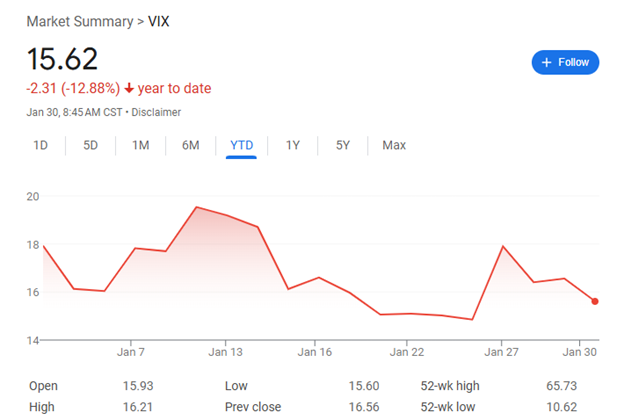
There have been supportive tailwinds from recent declines in 10-year Treasury yield, the U.S. dollar and the CBOE Volatility Index (VIX)#, often dubbed the market’s “fear gauge”:
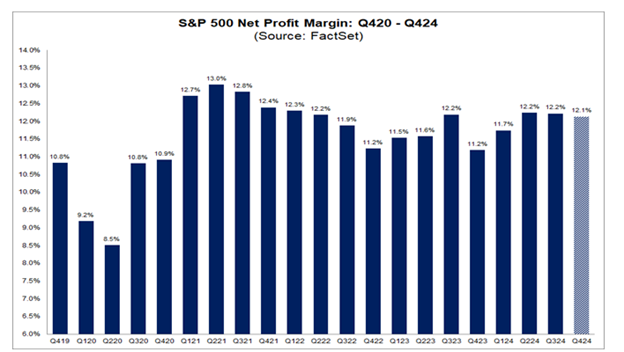
Additionally, while it’s still early in earnings seasons, they have been positive overall. For instance, net profit margins are tracking above 12% for the third straight quarter:
However, there’s still been quite a bit of investor angst. So, we thought it would be helpful to do a sanity check and compare how equity markets are tracking in relation to Cornerstone’s original 2025 Market Outlook base case.
Six Fundamental Reasons
Overall, the market has exceeded our base case thus far. We believe there are six fundamental reasons for this.
- First Five Days
The market showed strength in the first five days of 2025, even if it wasn’t clear. This is important because, for whatever reason, equities tend to reveal their hands early in the year.
Since 1950, when the first five days of the year are positive after a prior year of greater than 10% returns, the current year’s median gain is 13% with a win ratio of 82%. This data points to higher conviction that 2025 can be another double-digit gain year.
- Individual “Bullishness”
As a contrarian indicator, there was a meaningful reset in sentiment, as evidenced by the 15-point collapse in the American Association of Individual Investors (AAII) Bull Index, which measures individual investor sentiment:
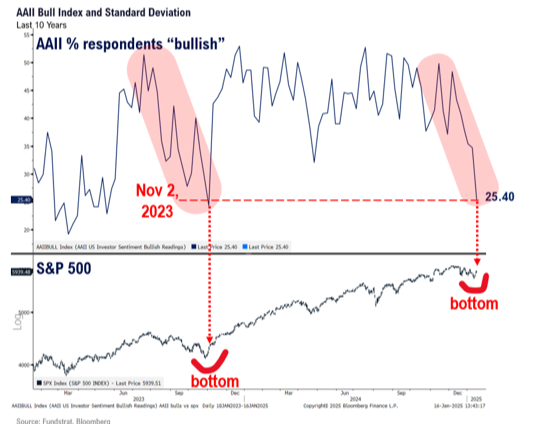
This is only seen at major lows like in November 2023 and October 2022.
The late 2024/early 2025 grind caused similar capitulation in sentiment which appears to have bottomed.
- Softer Inflation
Inflation data continues to point to further softening, with two specific data points worth mentioning.
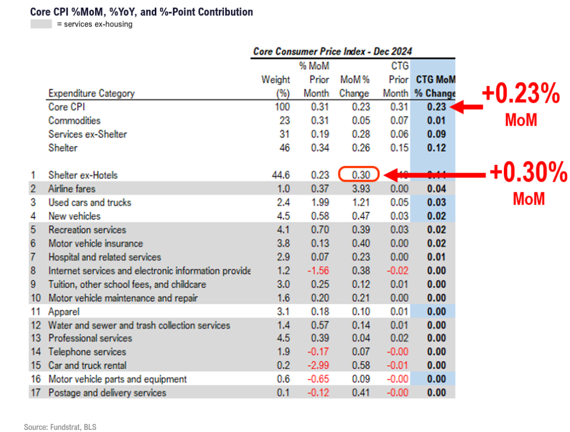
First, December’s core consumer price index, which excludes food and energy prices, rose 0.23%. That’s the lowest reading since July.
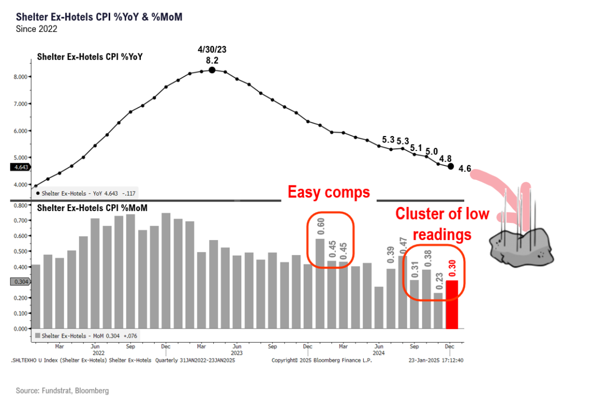
Second (and more importantly), the most stubborn inflation component – shelter – only grew 0.3% month-over-month, contributing 0.14% to core CPI. That’s one of the lowest readings since 2019:
Also, the Bureau of Labor Statistics’ New Tenants Rent Index recently showed falling rents on a year-over-year basis, breaking a stubborn trend:
- Declining U.S. Dollar
Major fears of across-the-board tariffs on day one of the new presidential administration permeated. But those seem overblown now, triggering a decline in the dollar as other currencies rallied:
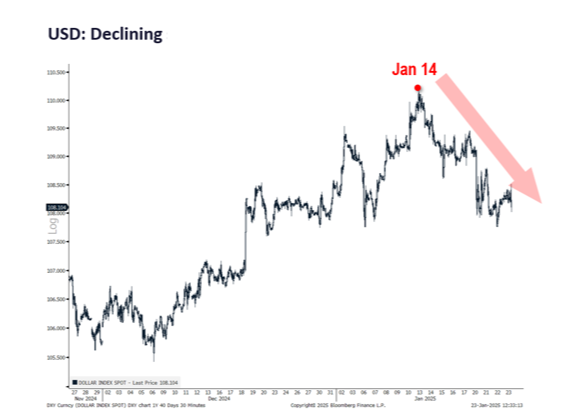
This has arguably also contributed to rates lowering and is extremely supportive of stocks.
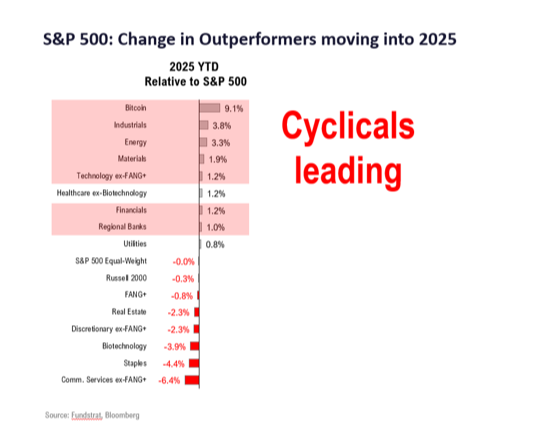
- Leadership Changes
It's clear that cyclical stocks have taken the lead. And that’s very much a risk-on signal. The best performing sectors are almost exclusively cyclical:
- Tight Credit Spreads
While there’s been fear over rates, diving deeper reveals tight credit spreads. That’s bullish for stocks.
Credit spreads refer to the premium companies pay versus Treasury yields to borrow money. Investment grade credit spreads tell us what high quality names (i.e., world-class companies) are paying to borrow money above what Uncle Sam pays.
These spreads are near record levels at only 80 basis points above comparable Treasuries. That's well below the long-term average of 132:
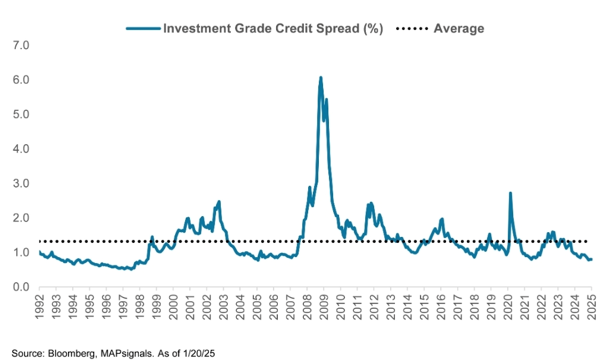
For perspective, 10-year Treasury yields are around 4.5%, so blue chip companies only pay about 5.3% to issue 10-year bonds right now.
This matters because tight spreads help insulate blue chips from rising rates. It’s partly why stocks and long-term bond yields often rise together.
Historically, stocks outperform when credit spreads are below 1%. This makes sense because super tight spreads ultimately reflect bond investors confidence in corporate America.
As our friends at MAPsignals prove, since 1989 the S&P 500 has averaged an 11.8% gain in the year following sub-1% investment grade spreads versus only 6.6% when spreads have been above 1%:
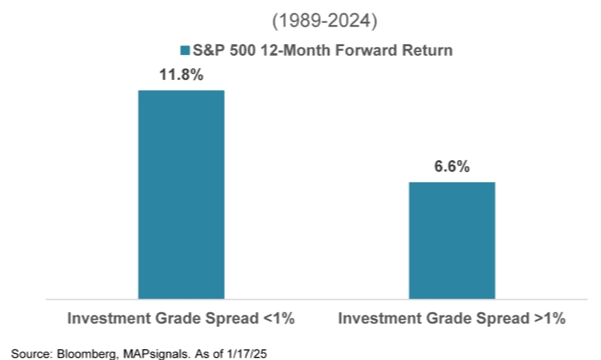
In these scenarios, stocks are also less volatile, with a maximum S&P 500 drawdown of 20% versus 69% in situations with 1% or more spreads.
Rely on Data
Let’s address the DeepSeek AI surprise and how quickly equity prices can change when emotion consumes “emotionless” markets.
After last Monday's volatility, investor conviction was in focus. We think those who bought into the AI trade late were the first to hit the exits when they were spooked by DeepSeek.
Yes, this may sound like Monday morning quarterbacking, but our fundamental thesis did not waver especially as we immediately theorized that the Chinese IP theft machine was back again. And that has turned out to be accurate.
Most importantly, we made sure to eschew emotion by relying on real time data.
Last Monday, many investors thought it was “game over.” Acting on that emotion will always prove costly over time.
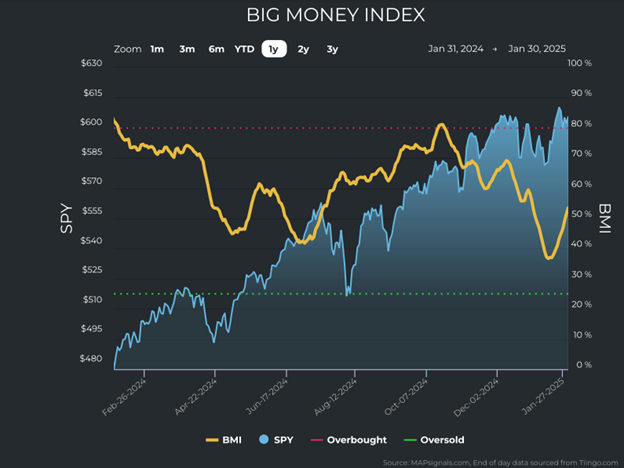
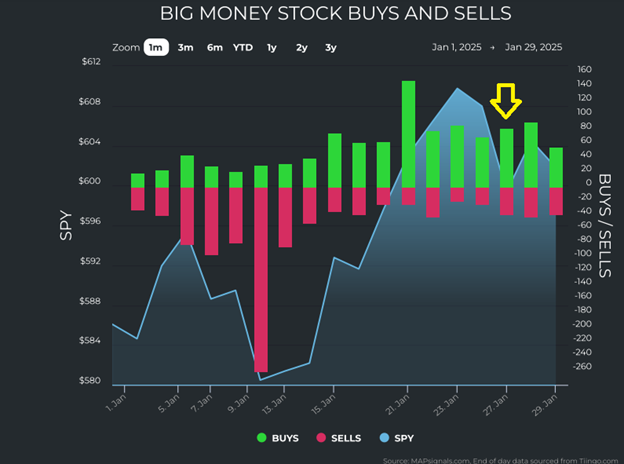
To understand DeepFake…I mean DeepSeek…we first turned to MAPsignals’ trusty Big Money Index (BMI), a 25-day moving average of netted “big money” institutional investor activity. Note the two-week uptrend continued with the BMI hitting 53.5% through last Thursday:
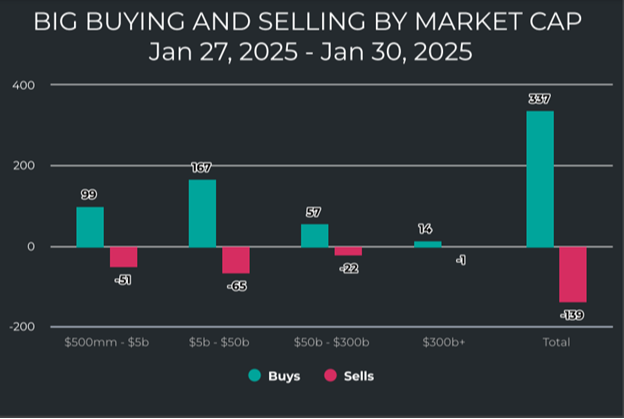
Focusing just on the index isn’t comprehensive though. By digging deeper we were able to see that even while emotional investors sold shares, there was actually healthy buying under the surface where it actually mattered.
From last Monday to Thursday, there were 337 buys against 139 sells, creating an almost 2.5-to-1 ratio indicating capital was being put to work:
Even more interesting, during last Monday’s “carnage,” buys outweighed sells 84 to 37:
But tech was being sold and everything else was being bought, right? Not exactly.
It was actually a net positive institutional buying day for tech. There were 11 buys against nine sells, with the buys surpassing the 25-day moving average (yellow line):
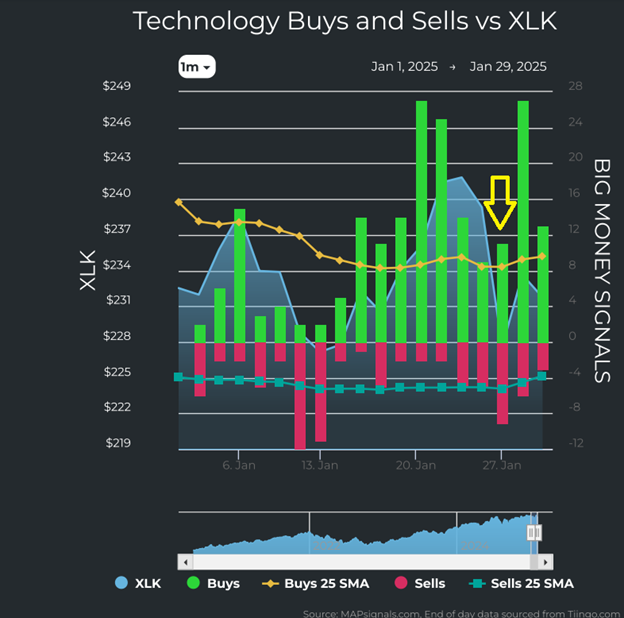
On a day of mass emotional selling, the “smart money” was conversely putting money to work in the tech sector.
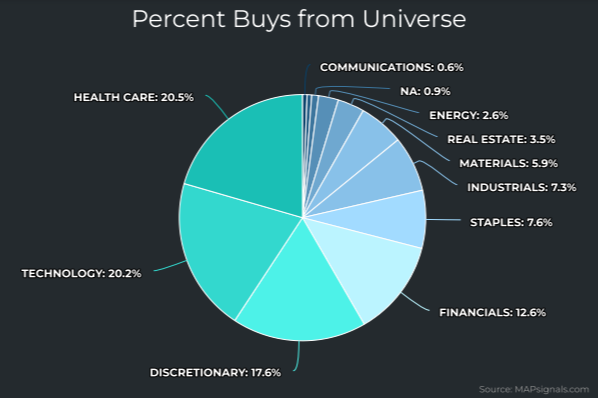
Understanding all this, it now shouldn't come as a surprise that last week’s money flows spotlighted three sectors receiving outsized institutional accumulation. They’re technology, health care, and discretionary:
While Monday wasn’t fun it is part of the investing journey. Remember, these times are opportunities to rely on data – it keeps you in the game when the undisciplined and emotional investors run away.
* Links to third-party websites are being provided for informational purposes only. CoreCap is not affiliated with and does not endorse, authorize, or sponsor any of the listed websites or their respective sponsors. CoreCap is not responsible for the content of any third-party website or the collection or use of information regarding any websites users and/or members.
*Past performance does not guarantee future results.
*Investing involves risk and you may incur a profit or loss regardless of strategy selected.
* The S&P 500 is an unmanaged index of 500 widely held stocks that is generally considered representative of the U.S. stock market.
# The CBOE Volatility Index is a measure of the short-term volatility of the S&P 500 indexes, indicating how quickly market sentiment changes and the level of investor confidence or fear in the market.
Securities sold through CoreCap Investments, LLC. Advisory services offered by CoreCap Advisors, LLC. Cornerstone Financial and CoreCap are separate and unaffiliated entities.