

Before building upon part one of Cornerstone’s 2025 market outlook, we want to address some recent “bridge data” to connect the two parts of next year’s forecast.
Earlier this month, it seemed many investors gave up on stocks as the Dow Jones Industrial Average* fell for nine consecutive days. But as we’ve said before, such hidden capitulation is a bullish oversold signal.
And in the holiday-shortened week, the S&P 500# reflected this, gaining 2.9%.
Unusual trading volumes leave institutional footprint clues. For instance, look to Dec. 20, when an incredible 1,746 stocks and exchange-traded funds traded in unusual fashion:
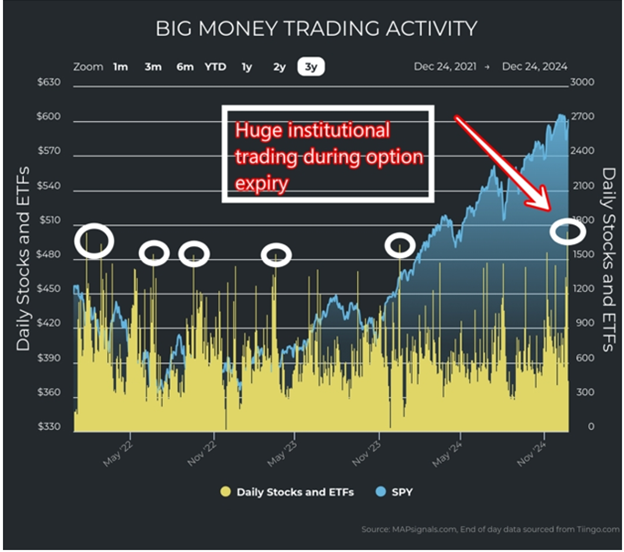
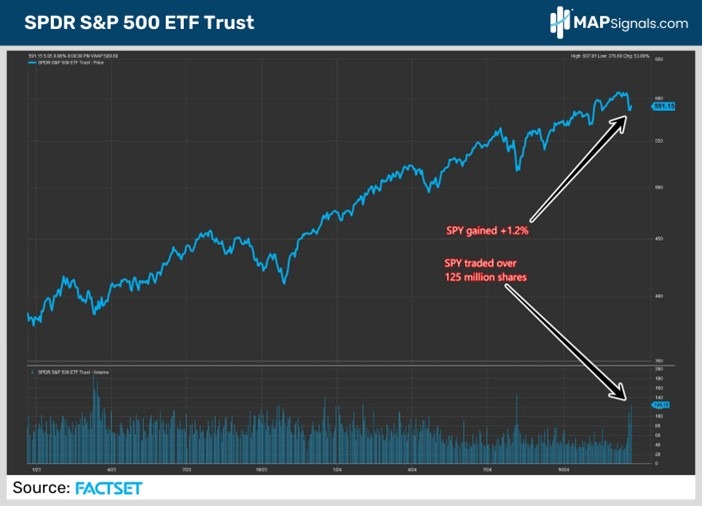
It’s easy to brush this off as heavy trading due to option expiration. But on Dec. 20, something relatively rare occurred: the SPDR S&P 500 ETF Trust (SPY), a proxy for the S&P 500, gained 1.2% while trading over 125 million shares.
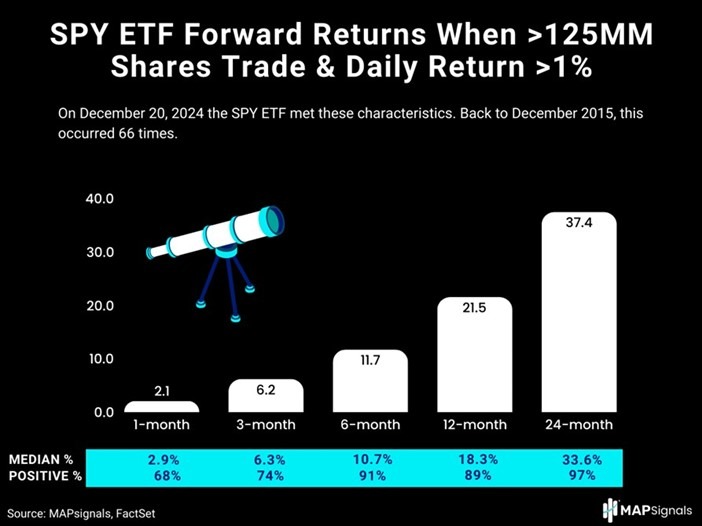
This is a bullish catalyst going into 2025.
Looking back to 2015, our friends at MAPSignals found 66 occurrences where SPY gained 1% or more while trading at least 125 million shares. As you can see, forward returns are great, reflecting pure alpha:
But isn’t that a short trading history? Yes, but context is required.
This bullish catalyst hasn't come along for decades, meaning the Dow hasn't fallen for nine consecutive days since 1978. So, going back to 1942 with the Dow, our friends at MAPSignals were able to find 17 prior instances of this action taking place, and the forward outlook is consistent:
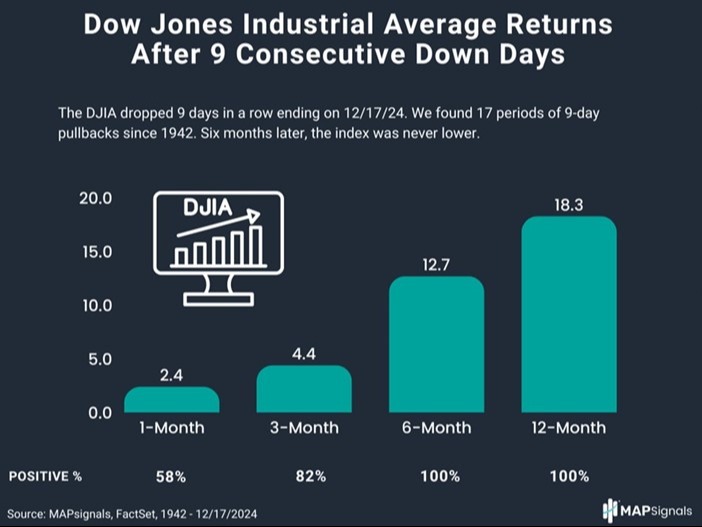
This rare oversold signal is 100% undefeated after six months, historically.
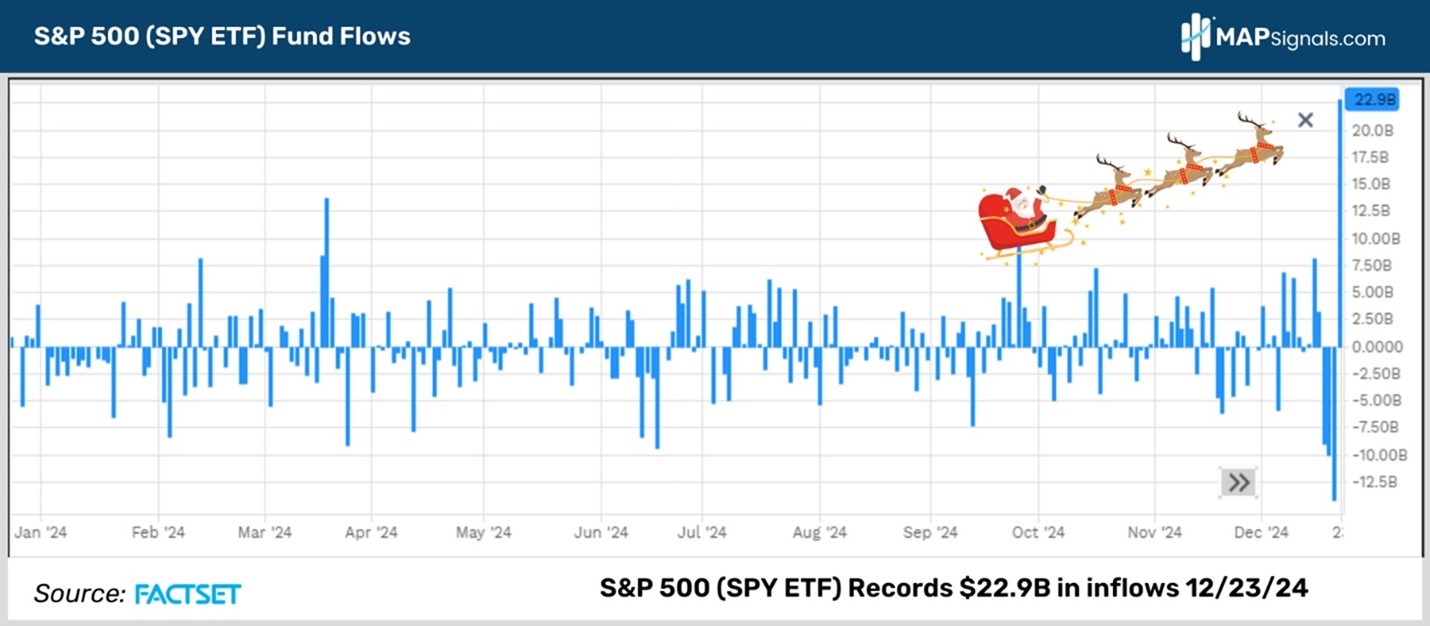
Thus, we can remain comfortable that the foundation is being laid for another Santa Claus rally as a whopping $22.9 billion found its way into SPY on Dec. 23 alone:
Did anything change, fundamentally?
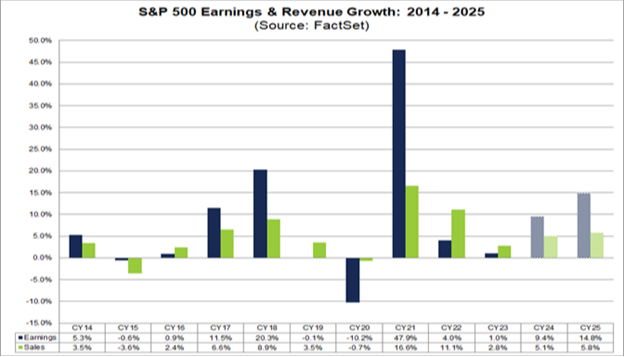
We’ll direct your attention to FactSet’s final 2025 analyst outlook for earnings, revenues, and profits, which was released on Dec. 20.
That report projected 2025 S&P 500 earnings growth of 14.8%. That’s well above the 10-year trailing average of 8%. It’s also well past the 9.5% figure released by the same analysts a week earlier!
Interestingly, as of Dec. 20, analysts expect the “Magnificent 7” companies to report earnings growth of 21% in 2025, while the other 493 companies report growth of 13%. Compare this to just a week earlier (bars on left) and the difference is striking:
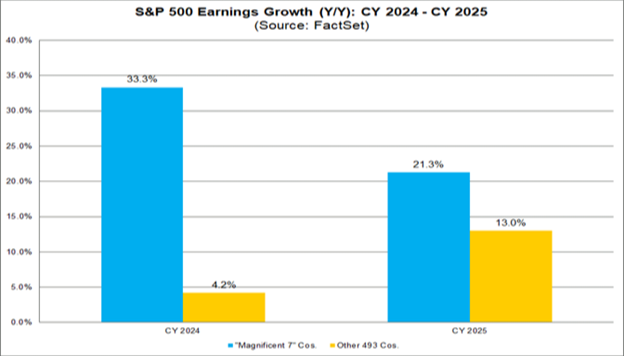
This is strong data pointing to widening breadth and strength in equities.
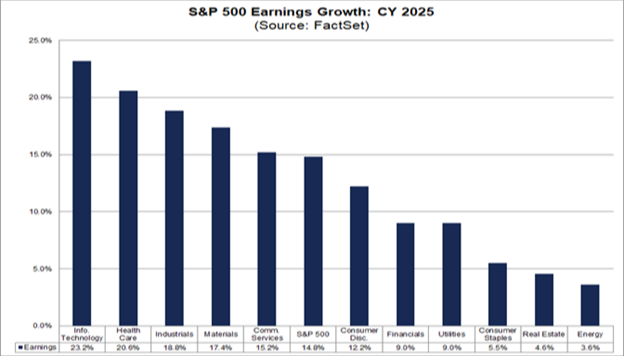
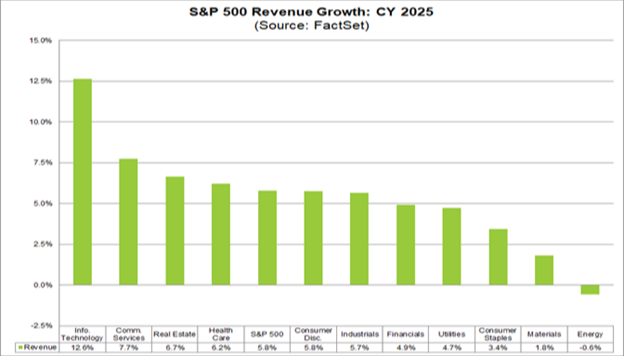
Continuing the momentum, all 11 sectors are predicted to report year-over-year earnings growth, (last week only eight of the 11 sectors were eyed for growth):
Furthermore, estimated year-over-year revenue growth for 2025 is now 5.8%. That’s above the 10-year average of 5.1% and 0.7% above last week’s reading.
Lastly, and most importantly, analysts now estimate the S&P 500’s average net profit margin for 2025 to be 13%:
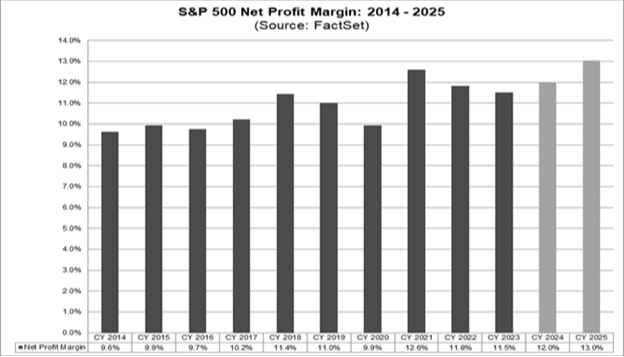
That outpaces the 10-year average of 10.8% and last week’s 12% estimate. If 13% is the actual annual figure, it will mark the highest level reported by the index since FactSet began tracking this metric in 2008.
This level of corporate strength easily supports the stock market’s trend reversal over the holiday season.
2025 Outlook, Part Two
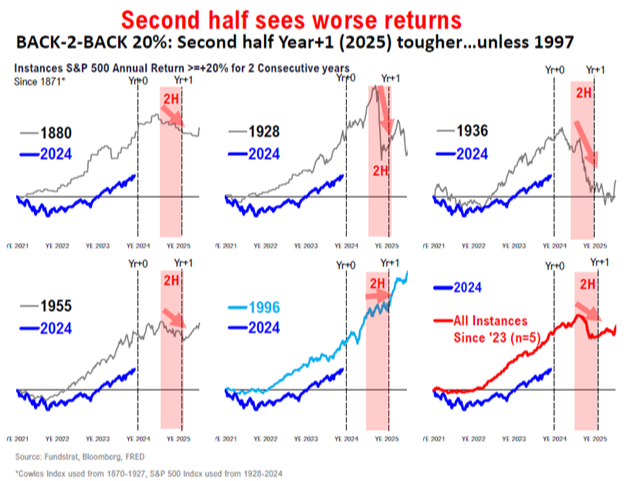
In further analyzing 2025, it’s important to recognize potential headwinds in the second half of the year even if purely based on history following back-to-back years of over 20% returns.
There are five past situations showing stocks struggle in the back half of the third year following 20% or more returns, with 1997 being the outlier:
What could make 2025 an outlier is that we’re significantly lagging when it comes to four-year cumulative returns:
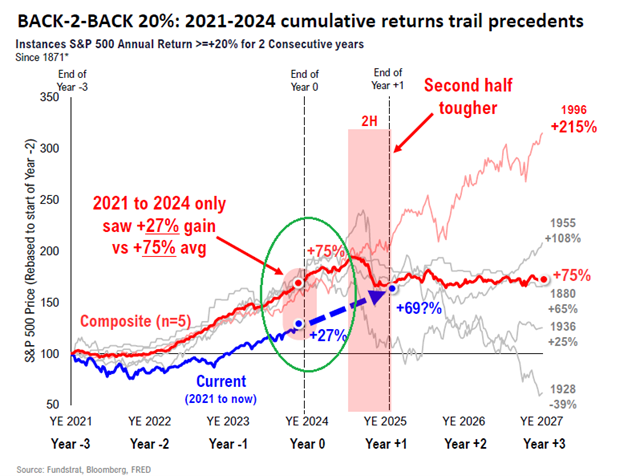
This conflicting historical data thus requires us to be somewhat conservative in our 2025 outlook because of a lack of second-half visibility. A handful of unknowns along with upcoming political and economic changes make it difficult to see what’s ahead.
This lack of visibility is a risk. What unknowns do we mean? Here’s a broad sampling:
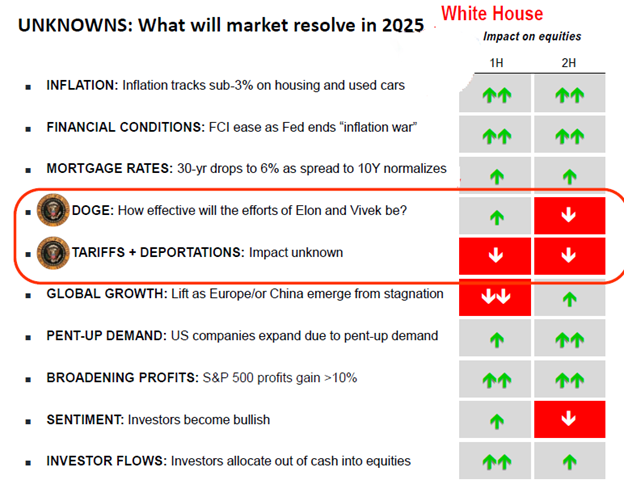
Given this, we want to finish our 2025 outlook by touching on four key themes related to second-half unknowns.
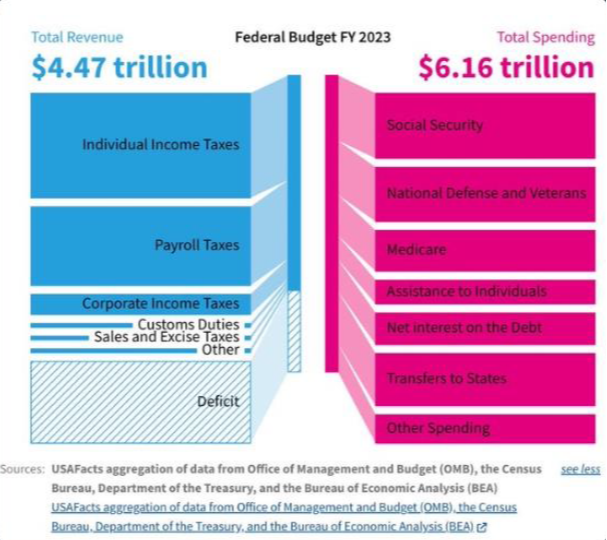
- Federal Budget Deficit
Our federal budget deficit is one of the greatest risks to continued economic growth and equity performance.
Government efficiency became a hot issue suddenly. We think these efforts could provide the most significantly surprising fundamental developments in 2025.
While some may wonder how this will unfold, in our research we were surprised to learn something similar took place almost 100 years ago. As a Senator, Harry Truman created a bipartisan Congressional committee to identify areas of poor procurement and government waste:
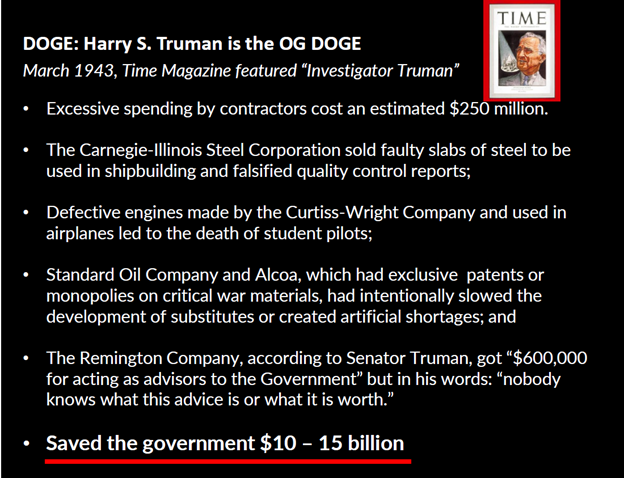
We don’t know what will happen today. But knowing a similar effort was completed successfully in the past brings some comfort that contractor-heavy sectors that will likely be negatively impacted like IT consulting, defense, and health care, can be helped further down the line.
- White House History
Markets in the second halves of the first year of Republican presidential terms have historically underperformed:
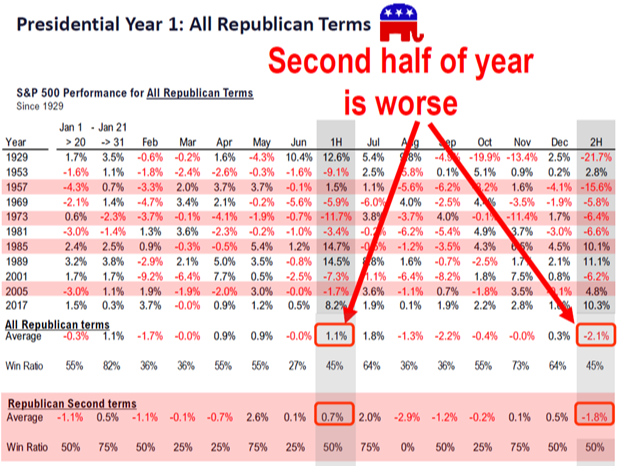
While somewhat anecdotal, we believe it’s fair to say this is often a result of significant economic policy change.
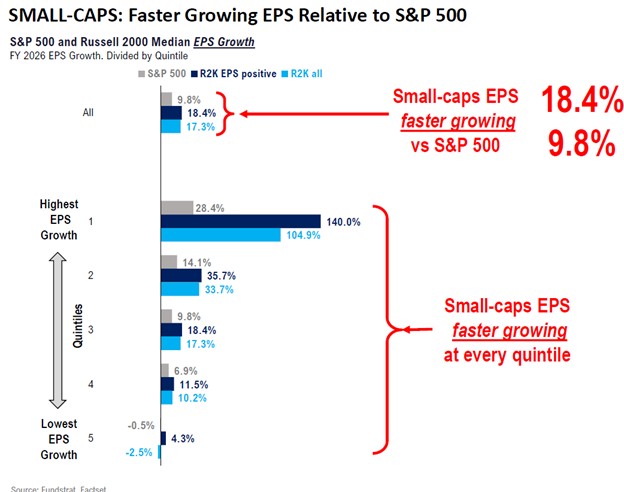
- Small-Cap Tailwinds
There's continued acceleration in the growth of per-share earnings in the small-cap laden Russell 2000^ versus the S&P 500 across every quintile:
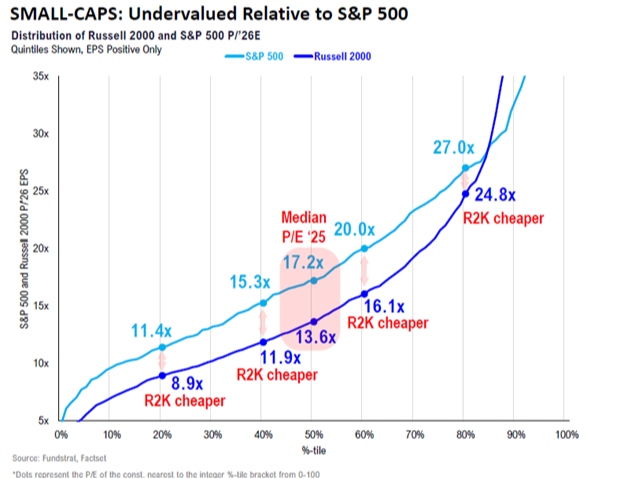
Small-cap stocks continue to be significantly undervalued relative to the S&P 500, providing broader access to equities at valuations that remain historically attractive:
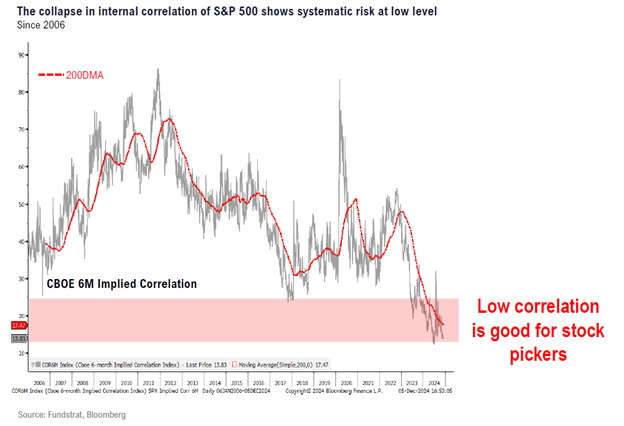
- Falling Correlations
Correlations between stocks fell to 20-year lows, which is extraordinarily positive for stock-picking outperformance. It also helps reduce the impact from macro drivers (except the Federal Reserve).
In this environment, valuations become systematically more important.
Year-End Target
What does this all mean?
Well, taking everything into account – both the bullish data from the past two weeks and the headwinds causing a lack of visibility in 2025’s second half – we settled on a 2025 year-end target for the S&P 500 of 6,600.
This figure would still be expansive from a market breadth standpoint. It would also indicate a price-to-2026 earnings ratio of roughly 22, which would be slightly lower and more in line with long-term averages.
* Links to third-party websites are being provided for informational purposes only. CoreCap is not affiliated with and does not endorse, authorize, or sponsor any of the listed websites or their respective sponsors. CoreCap is not responsible for the content of any third-party website or the collection or use of information regarding any websites users and/or members.
*Past performance does not guarantee future results.
*Investing involves risk and you may incur a profit or loss regardless of strategy selected.
* The Dow Jones Industrial Average is a stock index tracking 30 large, American, publicly owned blue-chip companies and is generally considered representative of the broader U.S. economy.
# The S&P 500 is an unmanaged index of 500 widely held stocks that is generally considered representative of the U.S. stock market.
^ The Russell 2000 Index is a stock market index measuring the performance of the 2,000 smaller companies in the Russell 3000 Index and is widely regarded as a bellwether of the U.S. economy.
Securities sold through CoreCap Investments, LLC. Advisory services offered by CoreCap Advisors, LLC. Cornerstone Financial and CoreCap are separate and unaffiliated entities.