

After three weeks of 2025 trading into the new year, the market has seemingly found its footing.
As discussed in previous posts, this year got off to a rocky start. Equities progress had been weighed down by a couple things. One was fear of inflation reigniting. The other was rising long-term Treasury yields that would threaten to derail the Federal Reserve’s progress to get interest rates down to their long term target of 2.5%.
As we touched on last week, new data began to flow, and the equity market got a needed lift from lower inflation, retail sales, and slightly higher than expected initial unemployment claims. This alleviated pressure on the 10-year Treasury, causing yields to fall to around 4.6% after threatening to pierce the 5% threshold:
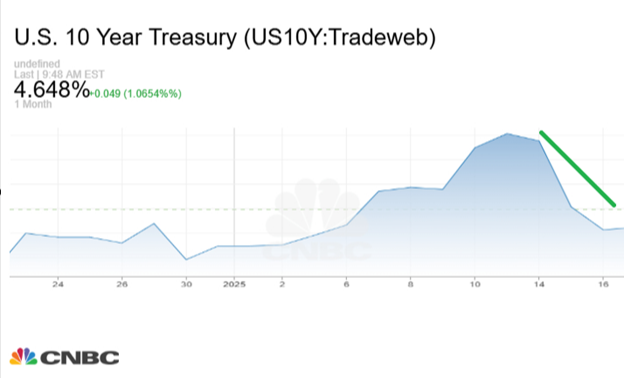
This gave investors confidence that the bond market was stabilizing, which in turn triggered a rally that allowed the S&P 500* close at a record high last Thursday, crossing the 6,100 level.
All signs currently indicate the bulls once again got the “all clear” from the bond market. This began to reveal where most investment capital was being was being allocated, which provided us with a near-term road map of what themes, sectors, and stocks will likely lead the market going forward.
Recent money flow data has been enlightening as we again are seeing the market broaden out. Large flows are heading towards specific sector themes – more on this in a bit.
First, let’s dig deeper into the data that confirms the “buy the dip” regime is back.
The turbulence in equities from Dec. 6 – Jan. 15 was a test of the bulls’ resolve. It's clear that shakeout indeed led to a collapse in investor sentiment:
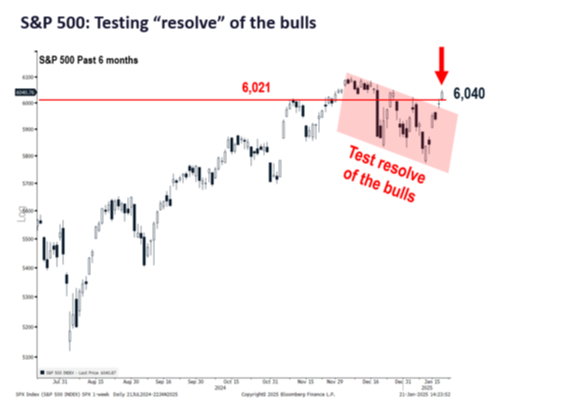
This was the case even though equities were rangebound for a month. We most definitely felt the negative effect of inflation hawks screaming that 6% yields were around the corner.
However, it now appears that executive and corporate confidence is returning.
A supportive datapoint is the Institute for Supply Management’s (ISM) Manufacturing index. It has been below 50 for the past 26 months (above 50 indicates growth, below 50 indicates contraction):
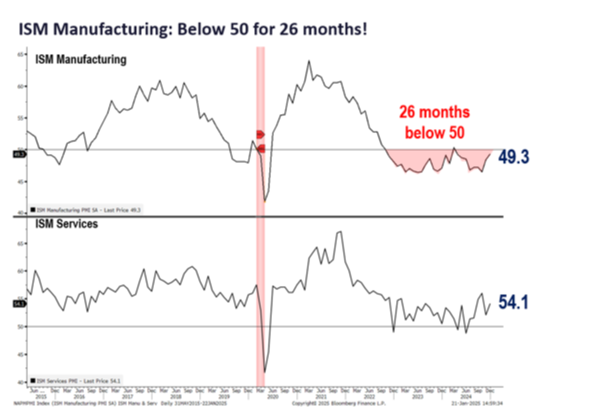
It will almost assuredly move above 50 this month.
Why does that matter?
Since 1950, this has been the ISM Manufacturing index’s longest stretch below 50. The second longest stretch was 25 months, back in 1989-1991:
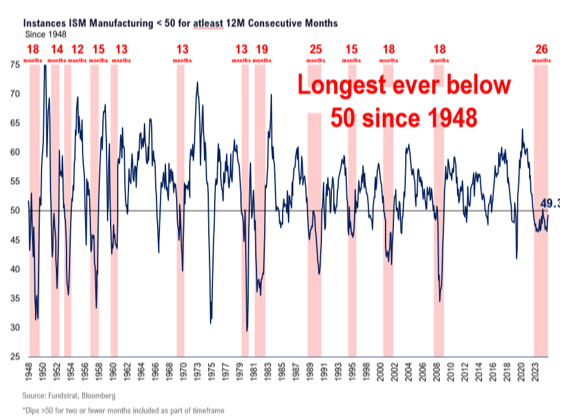
If we're right and the index breaches 50, it's important from a historical standpoint because that action typically precedes cyclical earnings growth acceleration by about four months:
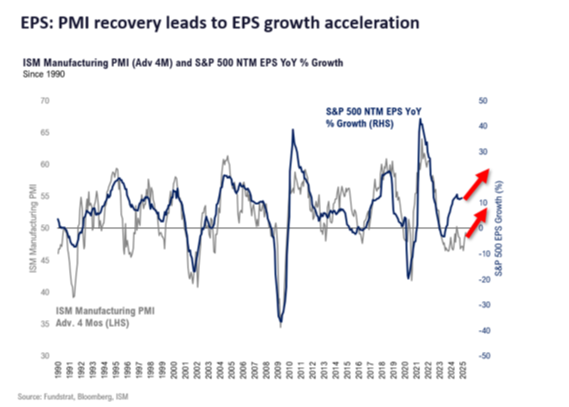
Thus, it’s reasonable to think S&P 500 per-share earnings would see even more accelerated earnings growth, especially from cyclical sectors like industrials, financials, discretionary technology, and more.
As a matter of fact, we can point to early earnings data that’s supportive of this thesis already. The financials sector, which is among the first to report earnings, is showing immense earnings growth:
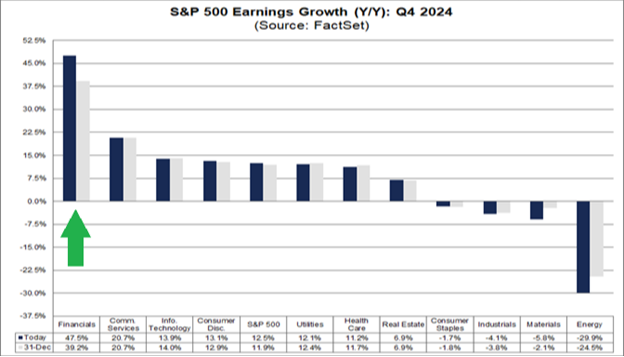
This evolving data provides support of our base case market outlook for the first half of 2025.
We can find additional supporting data for this flip after the market reached a rare pain point a couple weeks ago. While it’s hardly ever advisable to catch a falling knife, as you can see, it’s clear how the Big Money Index (BMI) from MAPsignals has put in a low and is now marching higher:
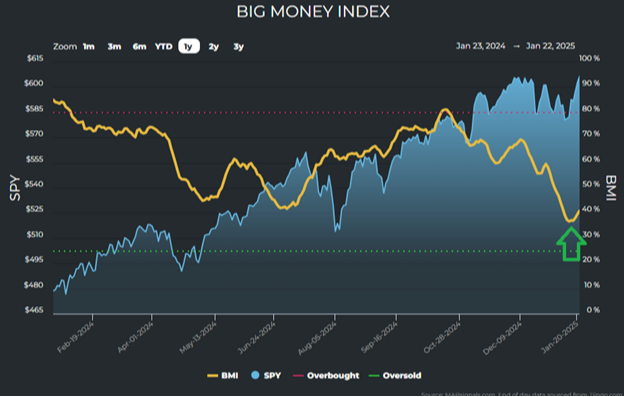
Remember, the BMI is a 25-day moving average of netted “big money” buys and sells. When it moves up, money is entering the market. When it falls, money is exiting.
The BMI beginning to march higher is indicative of new bullish behavior from “big money.”
The reason the data had a quick change of character is actually fairly straightforward. Revisiting the theme of significant money heading to certain sectors: money is chasing high quality technology stocks.
Using the Technology Select Sector SPDR Fund (XLK) exchange-traded fund as a proxy, we can see how it has ramped as new capital is being put to work:
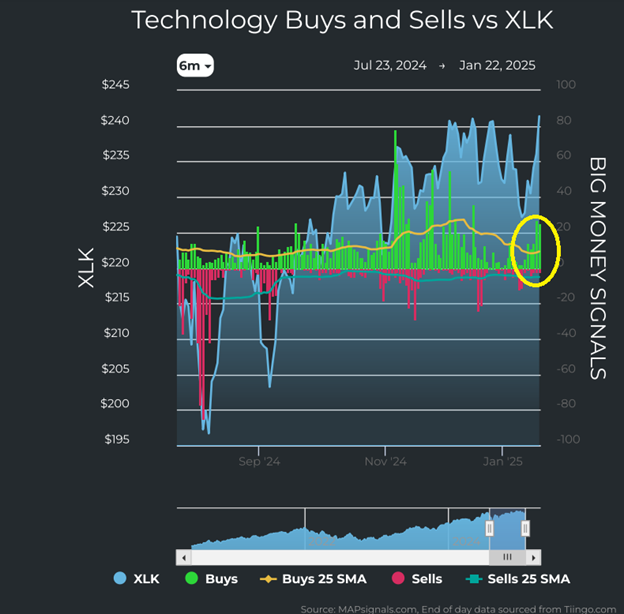
Drilling down even more, the capital is heading to companies involved in AI. More specifically, money is going into AI-centric infrastructure, software, and application build out. In other words, the use cases for AI are starting to materialize.
According to the International Data Corporation, 2025 global AI spending is now projected to reach $337 billion. Generative AI spending is expected to see 71% growth, which is reflective of improving productivity among relevant businesses.
Consequently, the building of data centers to power AI will also experience significant growth and capital investment. Increased demand for data center capacity has a global growth rate of around 15% per year just to support the ever-increasing workloads.
In 2025, more data centers will be under construction in the U.S. than ever before, according to real estate firm CBRE, which now expects 4,750 data centers to be built:
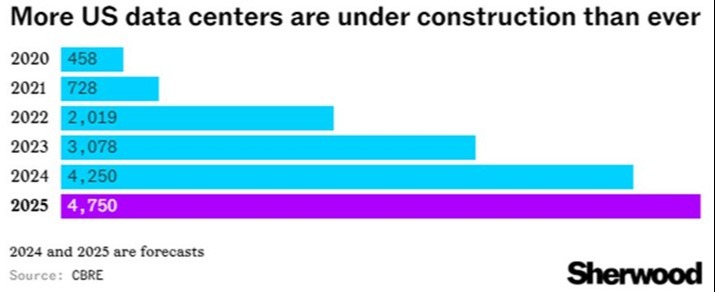
To put this into context, CBRE notes that nearly as many data centers are currently being built as already exist in the U.S.
This rapid expansion also presents an ongoing challenge of power constraints and the need for innovative solutions to meet growing energy demands. The U.S. Department of Defense projects the electricity transmission system will need to double in size between 2020 and 2050. Doing so would require adding approximately 7.1 gigawatts of capacity and nearly 1,000 miles of power lines across multiple states.
From an infrastructure standpoint, it's clear the year ahead will see business flourish for engineering and construction companies as the U.S. power grid is expected to go undergo significant expansion.
We think this is important because each of these themes can be a stealth bull market on its own. These areas are where the greatest amount of investment capital is flowing. And that’s reflected in the BMI money flow trend and sector metrics.
When it comes to this AI investment theme, there are other subsector areas of growth too. Use cases are evolving in finance and banking, health care, private equity, retail, and more.
Putting this all together, we can see where investors will be following the “big money.”
* Links to third-party websites are being provided for informational purposes only. CoreCap is not affiliated with and does not endorse, authorize, or sponsor any of the listed websites or their respective sponsors. CoreCap is not responsible for the content of any third-party website or the collection or use of information regarding any websites users and/or members.
*Past performance does not guarantee future results.
*Investing involves risk and you may incur a profit or loss regardless of strategy selected.
* The S&P 500 is an unmanaged index of 500 widely held stocks that is generally considered representative of the U.S. stock market.
Securities sold through CoreCap Investments, LLC. Advisory services offered by CoreCap Advisors, LLC. Cornerstone Financial and CoreCap are separate and unaffiliated entities.