

While it’s maybe surprising considering how October’s market performance has felt scattered, but as of this writing, the S&P 500* is up over 1% this month (as of this writing). Not bad for what’s seemed like an emotional rollercoaster.
That said, we at Cornerstone continue to be conservatively constructive through the end of the year and expect the S&P 500 to at least hit 7,000 by then. Let us walk you through how we got there.
At a high level, our primary reasoning for a strong final 10 weeks of the year is as follows:
- Continued strong corporate earnings (more on that below).
- Transition to a dovish policy by the Federal Reserve after a nine-month pause.
- The AI value visibility remains strong and is getting stronger.
- Seasonal strength – the fourth quarter is typically the best one of the year.
In short, we think the markets could be returning to rational behavior. Let’s dig into the supportive details.
Let's start with earnings as last week was the first heavy week of reporting for 2025’s third quarter (90 S&P 500 companies reported last week and 55 the week before). So far, so good. Of the 145 companies that have reported, 87% are beating estimates with a median beat of 7.8%:
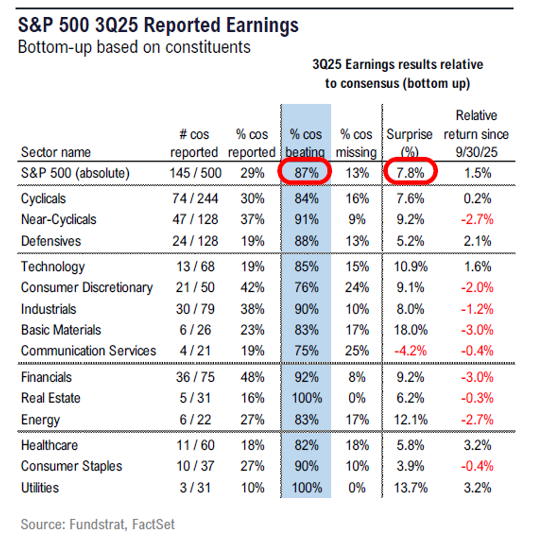
Importantly, the 13% of firms that have missed expectations only missed by a median of -3%. With the current median surprise of 6.3%, it means the actual year-over-year earnings growth for the companies that have reported is 14.9%, as of this writing:
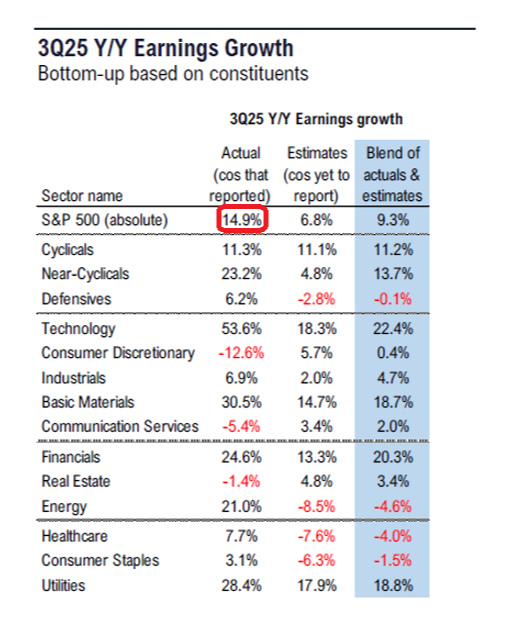
That’s fantastic. It’s playing out as anticipated.
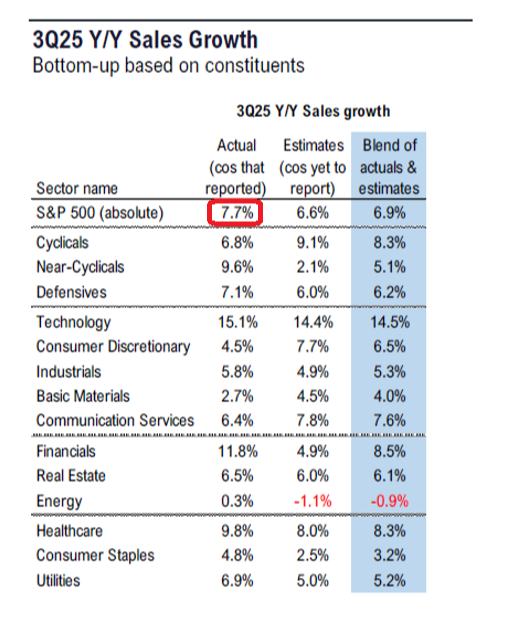
Also, per-share earnings growth is clearly not just a product of strong corporate governance and price controls. As you can see, EPS growth is buoyed by year-over-year sales growth:
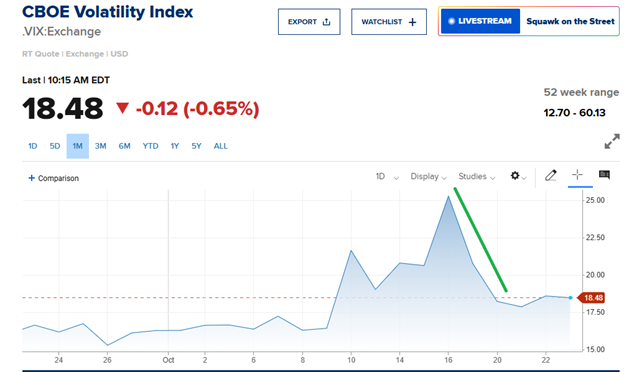
This developing fundamental foundation offers strong arguments that a year-end rally is still intact. This is especially true considering the significant de-risking in the CBOE Volatility Index# (VIX) after a short, emotional surge before fundamentals once again took control of the narrative:
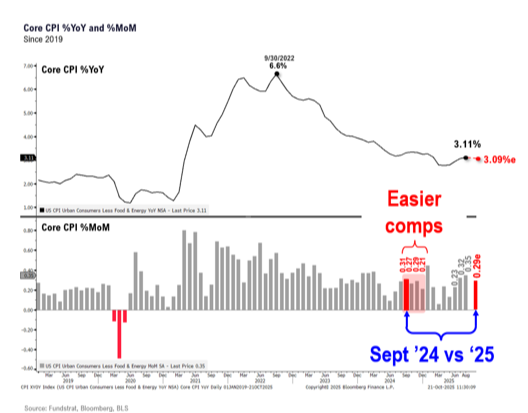
Thankfully, we now have consumer price index data to add to the mix. It’s the first government economic data since the shutdown started.
The CPI came in slightly below expectations, showing a 0.3% increase in monthly prices, which puts annual inflation at 3%. This data is further supportive of the Fed continuing to cut rates.
From an economic and market data standpoint, the seasonals remain favorable and supportive of at least an additional 5% upside into 2026. But that’s arguably conservative considering the Fed only started cutting in September and today’s situation is beginning to have similarities to September 1998 and September 2024. In both those instances, the S&P 500 gained 13% in their respective fourth quarters.
Money Flows Analysis
Understanding the positive foundational support in macroeconomic and market data, let’s peel back the onion and examine the underlying forces that move markets: money flows. First, we’ll look at MoneyFlows’ trusty Big Money Index (BMI), which is a 25-day moving average of institutional investor activity.
Over the last month or so, the BMI has slowly edged lower:
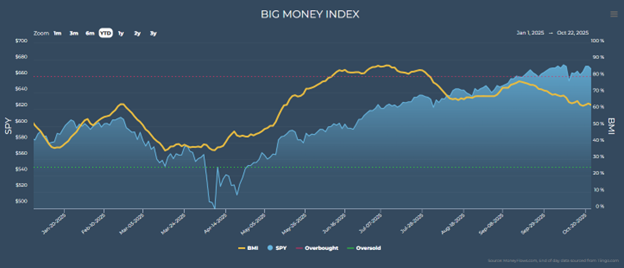
When this happens, it means that on the surface, outflows outweigh inflows. But this can happen for several reasons, especially when it is merely a result of steady overall flows with a slight uptick in outflows:
In this scenario, we don't see the BMI drop quickly off a cliff, but instead slowly drift down. This happens because inflows remain consistent even when a slight uptick in outflows lightly pulls the index down.
Typically this action does not signal a top of the market. Instead, it marks a normal pause for backing and filling after a long climb. We've seen this time and time again.
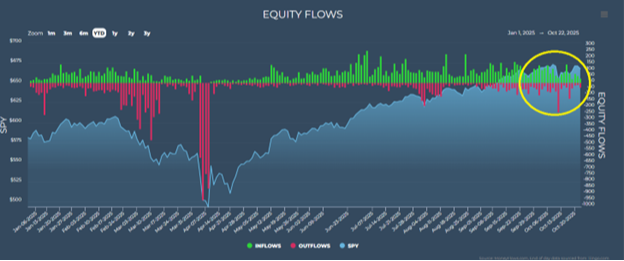
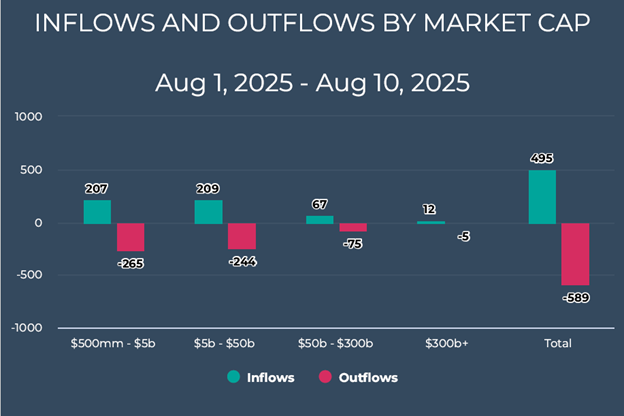
Just go back to this summer. First, let's look at the week of Oct. 10-17, when the VIX emotionally popped:

In that span we had net outflows over a week of trading for the first time since August.
But if you can recall what happened in August, we said the dip was a consolidation pause rather than reflecting structural weakness.
That turned out to be correct as the dip was fleeting.
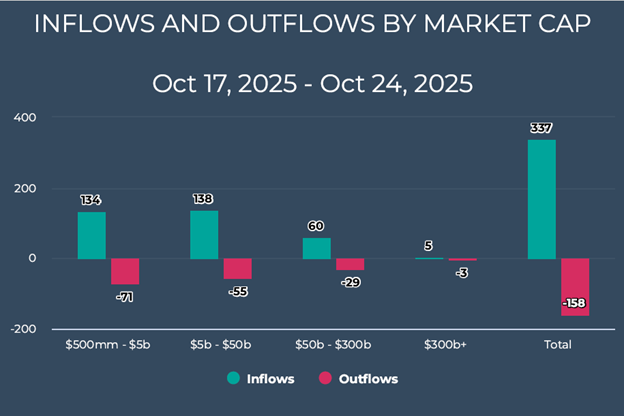
Now it appears the underlying momentum in the market is once again beginning to reverse after a short pause. Over the last week of trading, inflows have begun to outpace outflows:
With enough repetition, the lesson learned here is simple. That is, small short-term negative readings don't matter as much as their intensity and duration. Brief downticks are normal. The real trouble begins when there’s prolonged structural damage underneath the surface.
However, current data shows no signs of such weakness. So, what was behind the early-quarter pressure? In a word: financials.
There were bouts of extreme volatility and outflows as whispers of bad loans made by a couple of regional banks brought back nightmares of Silicon Valley Bank’s meltdown. This seems to happen every few years.
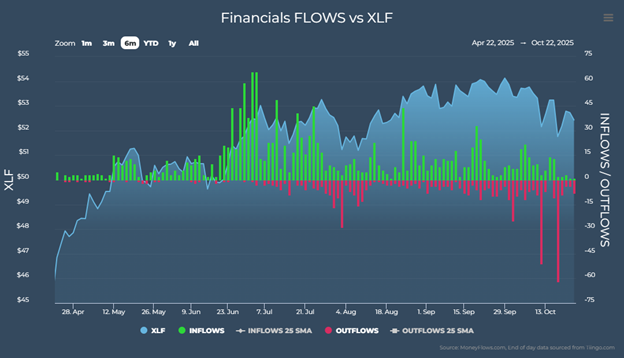
For perspective, the red line above from two weeks ago reflects 62 financial outflow signals alone, which was the most since the market's April temper tantrum. Is this structural weakness or emotional tantrums?
History, both recent and past, shows that isolated crises like this typically prove more contained than feared. Our hunch is that this will have a similar outcome.
Why?
This “new concern” is directly the result of recent bankruptcies of First Brands and Tricolor Holdings (who play in the subprime, highly risky market). Even worse, they fraudulently used the same collateral to get loans from multiple banks without those banks knowing.
These events are more corporate fraud and malfeasance than a structural contagion. To support this, we can merely look at the junk bond market, where spreads haven't risen to any concerning levels:
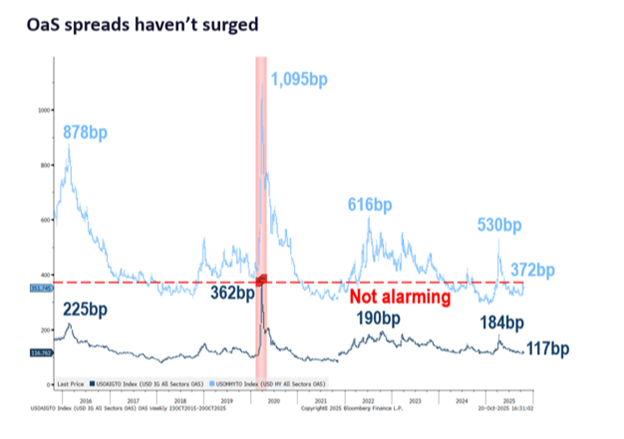
The spread on junk yields compared to Treasurys hasn't even come close to the 2025 highs reached around April. If investors were truly worried about a structural problem leading to more issues down the line, they would be demanding a significantly higher premium from high yield and even investment grade bonds. That simply is not taking place.
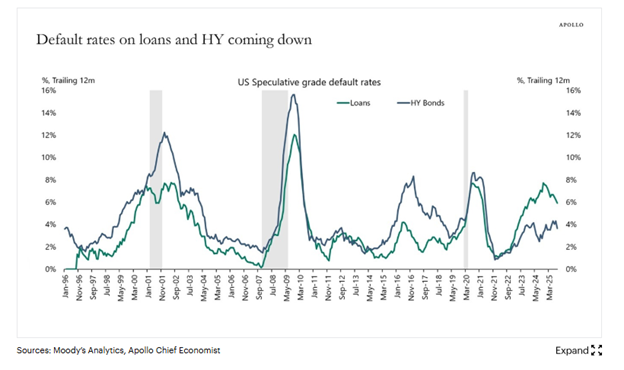
Additional interesting data that counters the structural contagion narrative comes from Apollo. It suggests the credit backdrop might now be improving.
For instance, default rates on loans and high yield bonds are coming down and remain significantly off their highs:
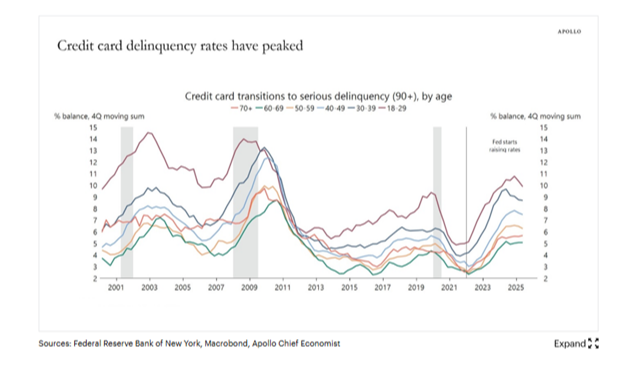
Additionally, Apollo’s Chief Economist Torsten Slok pointed out that credit card delinquency rates have peaked:
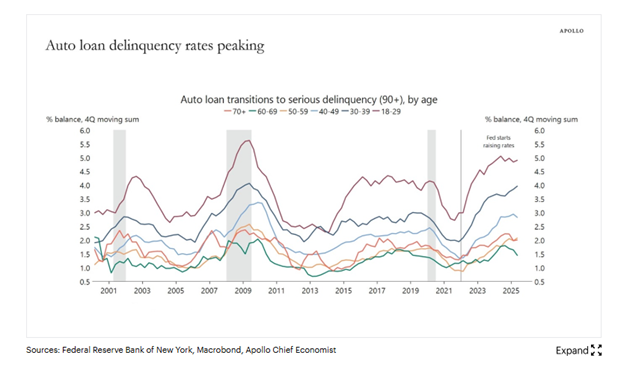
And auto delinquency rates now show signs of peaking:
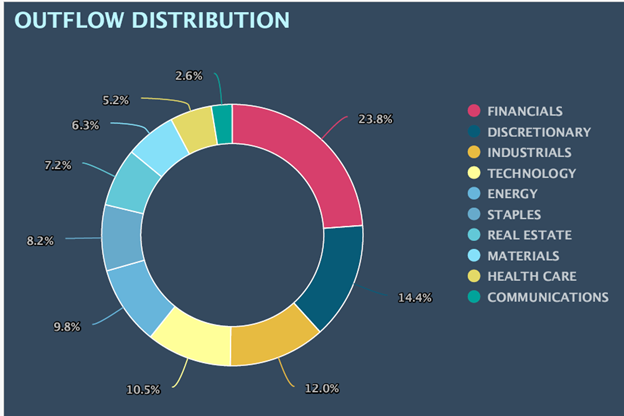
Taken together, it shouldn’t be surprising that during the mid-October volatility, the financial sector accounted for roughly 24% of outflows:
Even financial names not related to banking were dragged down across the board.
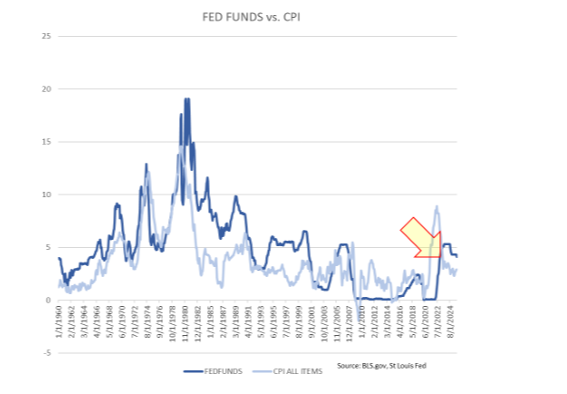
Frankly, this is exactly what consolidation turbulence looks like on an otherwise steady flight path. From a macro perspective, the data tailwinds are still in play. The Fed will continue to cut as the long-term inflation trend remains lower, which will finally narrow our long-awaited spread between federal funds rate and the consumer price index:
Meanwhile, fiscal policy is continuing to turn friendlier for businesses. That’s beginning to be reflected in earnings (remember this quarter’s 14.9% EPS growth so far), even as they continue to sell more (sales are up 7.7%).
* Links to third-party websites are being provided for informational purposes only. CoreCap is not affiliated with and does not endorse, authorize, or sponsor any of the listed websites or their respective sponsors. CoreCap is not responsible for the content of any third-party website or the collection or use of information regarding any websites users and/or members.
*Past performance does not guarantee future results.
*Investing involves risk and you may incur a profit or loss regardless of strategy selected.
* The S&P 500 is an unmanaged index of 500 widely held stocks that is generally considered representative of the U.S. stock market.
# The CBOE Volatility Index is a measure of the short-term volatility of the S&P 500 indexes, indicating how quickly market sentiment changes and the level of investor confidence or fear in the market.
Securities sold through CoreCap Investments, LLC. Advisory services offered by CoreCap Advisors, LLC. Cornerstone Financial and CoreCap are separate and unaffiliated entities.