

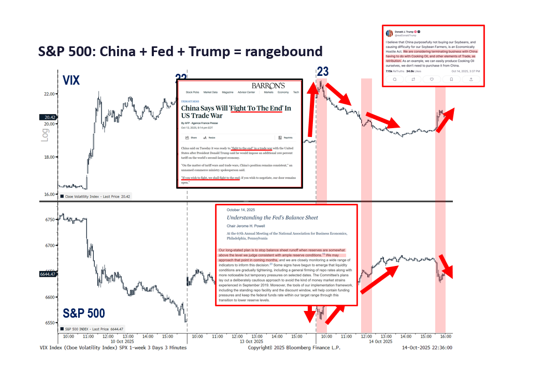
Last week stocks were knocked around as the White House and China exchanged inflammatory statements regarding trade once again. It's almost like the market still hasn’t learned from the previous emotional reactions to trade rhetoric from earlier in the year.
As a result, when combined with the federal government shutdown and continuing speculation regarding what the Federal Reserve will do later this month, we’re seemingly stuck in a rangebound market pause. This can be seen in the S&P 500* and the CBOE Volatility Index# (VIX):
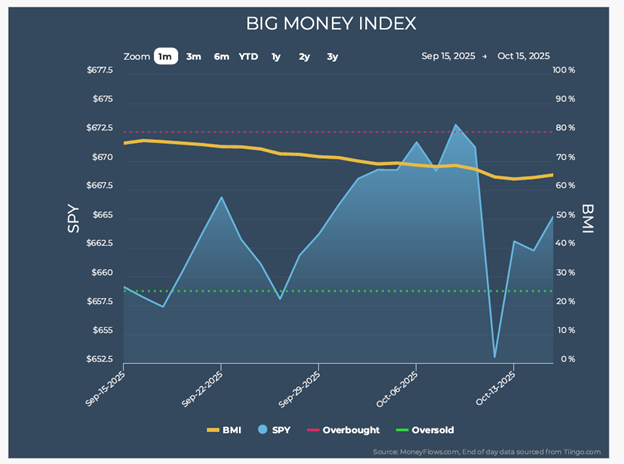
And we can also see it from a money flow perspective through MoneyFlows’ Big Money Index, a 25-day moving average of netted institutional investor activity. It’s been flattening:
As usual, what really matters – earnings – may very well be just the medicine the market needs to refocus itself.
Some want to raise fundamental concerns around the trade rhetoric causing the recent spike in volatility. Cornerstone’s perspective is these statements are nothing new as they were made in April and May too. So, it’s not necessarily an escalation of any sort.
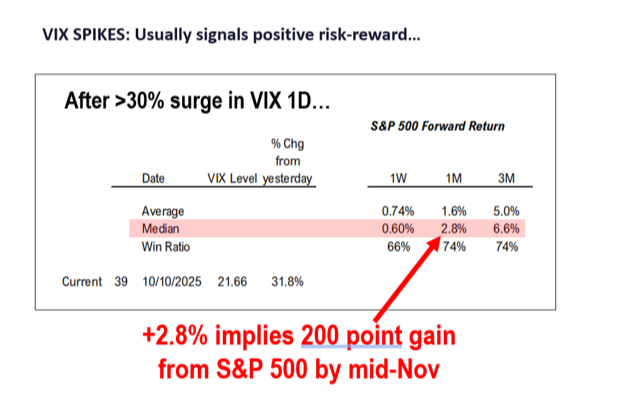
That being the case, we would find it hard to believe the most recent emotional reaction is “thesis changing” because we've seen this story unfold already. Historically, short-term emotional reactions that spike the VIX so much are quick capitulation moves reflecting a local bottoming:
As you can see, after unnatural spikes of this sort historically, the median gain would imply a self-correction to new highs by November:
Somewhat lost in this shuffle was Bloomberg’s striking data that only 22% of fund managers are beating their benchmark this year, which is bad on a multi-decade level:
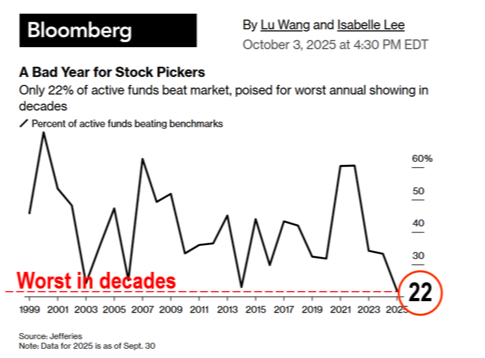
Why are managers underperforming? We think it’s because this has been the most hated V-shaped rally ever.
It's clear investors were too cautious and continually ignored objective fundamental data. Why point this out? Well, as we sit here today, a recent Bank of America fund manager survey happens to show once again how 33% of financial managers see an “AI bubble.”
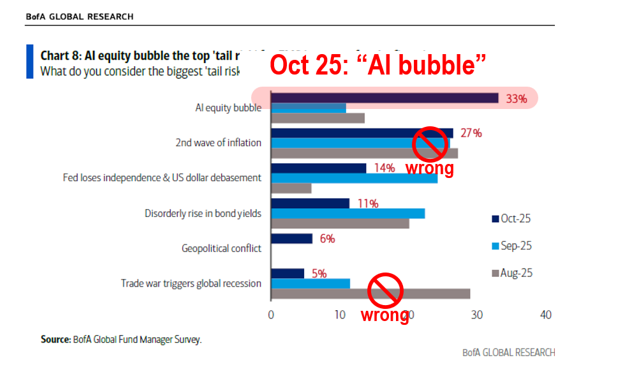
Once again, this is consistent with managers aligning with the popular headline narrative of the day throughout this year.
We take the contrarian position. Our healthy skepticism is anchored in actual data that clearly counters this fear.
See, if we’re in an AI bubble, then we must also be in an even bigger consumer staples bubble from a valuation, earnings, and profitability perspective. As an example that’s maybe surprising to some, NVIDIA’s forward price-earnings ratio is significantly lower than both Costco and Walmart when looking out one, two, and three years:
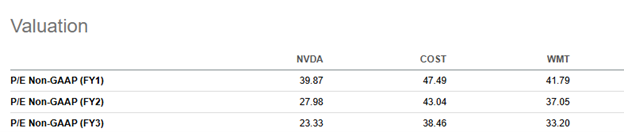
Let’s be clear: bubbles only pop when earnings aren’t there to support them.
These are the same managers that have argued all year the bull market is over and we should prepare for the bears. Unfortunately for them, historical data doesn’t support this belief because we know bull markets end when extreme exuberance takes over.
For instance, in the final 12 months of an elongated bull market, the market historically has posted a median advance of 27.6%, which is roughly three times the annual, historical 12-month average:
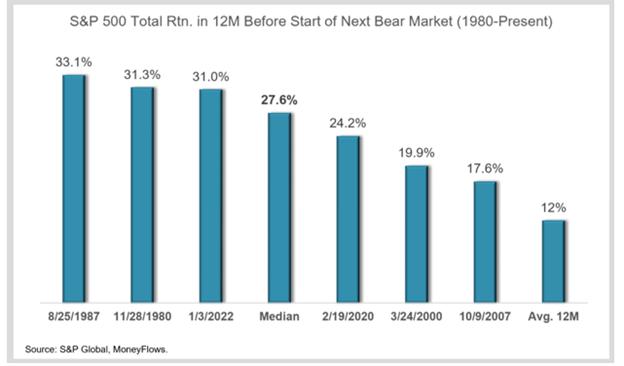
This happens when the crowd finally tires of missing out and begins to exuberantly pile into stocks. It turbocharges returns in the later phases of the bull markets. However, we clearly have not experienced such a level of FOMO (fear of missing out) yet.
Additionally, these same managers are the ones arguing the market is overheated because its P/E ratio is stretched and unsustainable. Looking at history though, we’d argue the current P/E ratio isn’t overextended but rather supported by increased profit margins resulting from our best friend – earnings:
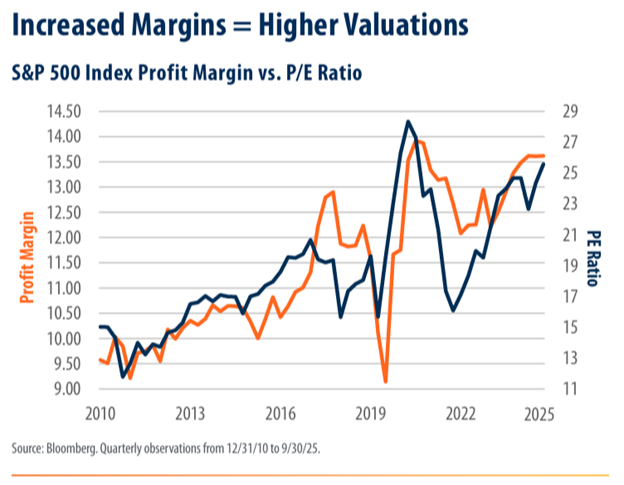
So, earnings are supporting profit margins that support the P/E ratio in a market that has not experienced FOMO yet. The only question left to ask is whether this quarter’s earnings growth will be strong enough to take our attention away from the headline rhetoric.
As of today, with earnings season still young, the S&P 500’s estimated earnings growth rate for the third quarter is 8%:
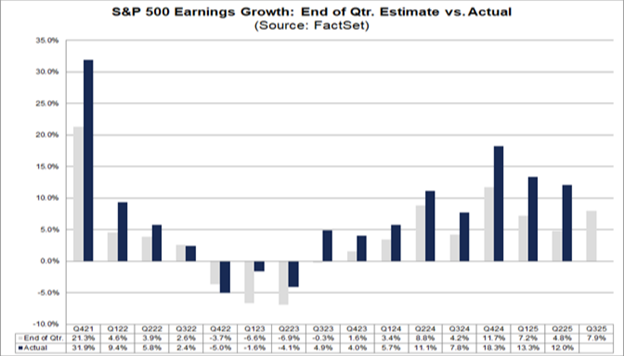
What is the likelihood the index will report earnings growth beyond this expectation?
Looking to history, we know the actual earnings growth rate has exceeded the estimated rate in 37 of the past 40 quarters. Over the past two years, actual earnings reported have exceeded estimates by 7%, on average:
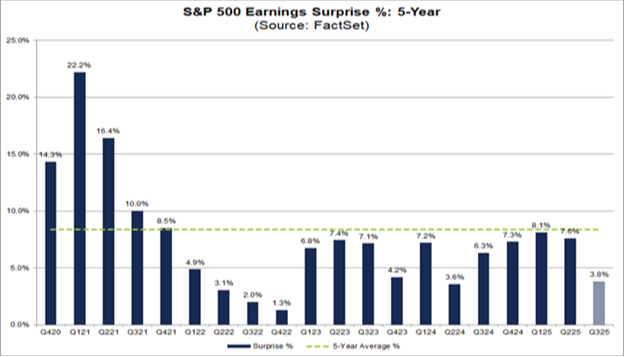
In that span, 75% of companies reported actual EPS above estimates, making the earnings growth rate rise by 5.7%. If we apply the most conservative historical average (see below) increase to current estimates, we could expect the annual growth rate for the quarter to be 13.6%.
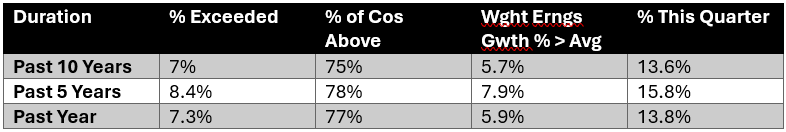
Again, based on the above data we can assume this earnings season will report year-over-year earnings growth of at least 13.6%. And that’s if we merely use the most conservative of those periods.
Earnings, and as a result profits, are what matter. That’s always been true. This quarter should further prove out the fundamental and foundational support for the market pricing valuations.
* Links to third-party websites are being provided for informational purposes only. CoreCap is not affiliated with and does not endorse, authorize, or sponsor any of the listed websites or their respective sponsors. CoreCap is not responsible for the content of any third-party website or the collection or use of information regarding any websites users and/or members.
*Past performance does not guarantee future results.
*Investing involves risk and you may incur a profit or loss regardless of strategy selected.
* The S&P 500 is an unmanaged index of 500 widely held stocks that is generally considered representative of the U.S. stock market.
# The CBOE Volatility Index is a measure of the short-term volatility of the S&P 500 indexes, indicating how quickly market sentiment changes and the level of investor confidence or fear in the market.
Securities sold through CoreCap Investments, LLC. Advisory services offered by CoreCap Advisors, LLC. Cornerstone Financial and CoreCap are separate and unaffiliated entities.