


About a month ago, everything was working. The Nasdaq Composite rallied more than 30% off its March low and AI was all anyone wanted to discuss. That kind of enthusiasm filled conversations and comment sections before a slow creep of overconfidence that inevitably precedes a market breather.
But markets don't usually reverse because the story changes overnight. It’s unrealistic. Typically, they unwind slowly as buying slows. Eventually, everyone who wanted to buy has already bought and there aren't enough new buyers to keep pushing prices higher until further fundamental earnings foundational support emerges.
This dynamic predictably coincided when the SpaceX euphoria began to roll over, so much so that it is now trading below its IPO price (consistent with historical precedence):
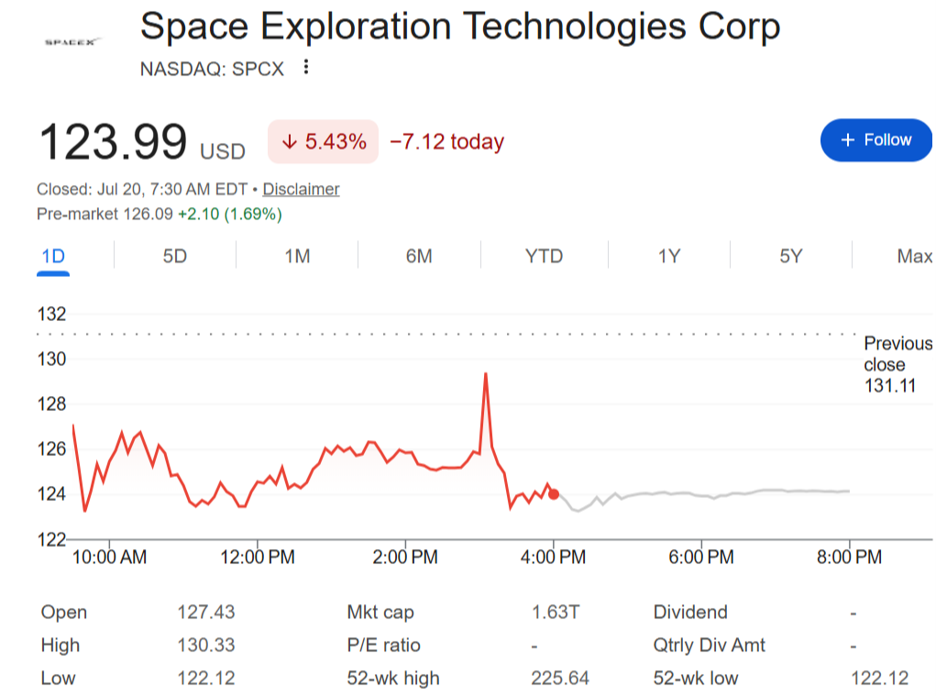
(Portfolio Manager’s Note: SpaceX is now trading below its initial public offering price, beginning to offer attractive entry points over the foreseeable near-term future for investors and portfolio managers alike, based on historical precedence of IPO’s of this magnitude. SPCX is not owned in Cornerstone client portfolios or by Daniel Milan personally.)
The SpaceX decline coincided with entering the slower summer months. We’ve seen many AI names follow as the excitement of new money entering the market daily began to fade, liquidity thinned out, and bids shrank.
Consequently, the algorithms and short sellers noticed. When buyers step back, someone always tests the market to see how much selling is left. Before long, a perfectly normal pullback begins to feed itself. That's exactly what we've experienced recently:
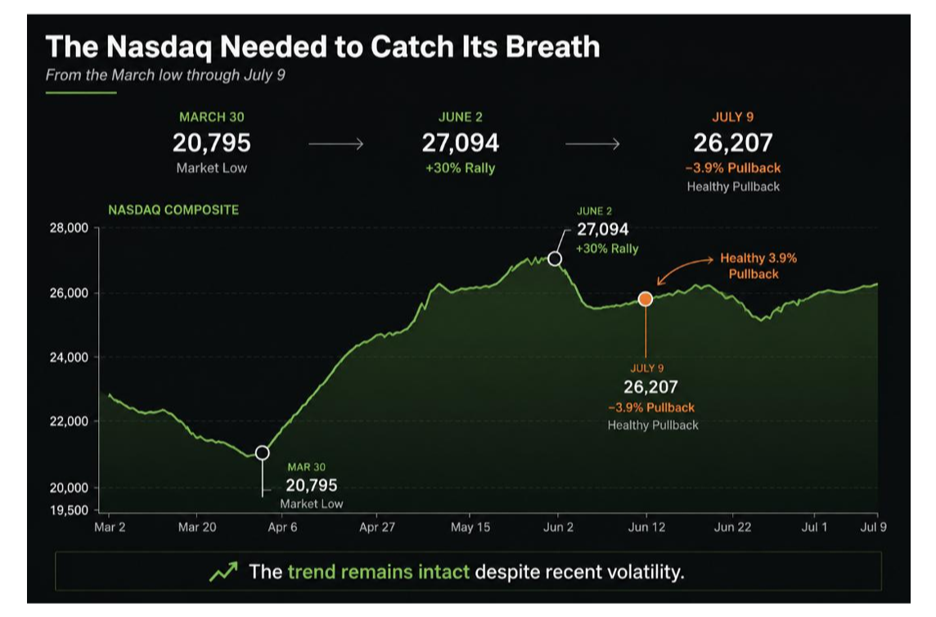
What makes this week different from the headline story is invisible in the indices. The S&P 500 is roughly flat with the Nasdaq modestly lower.
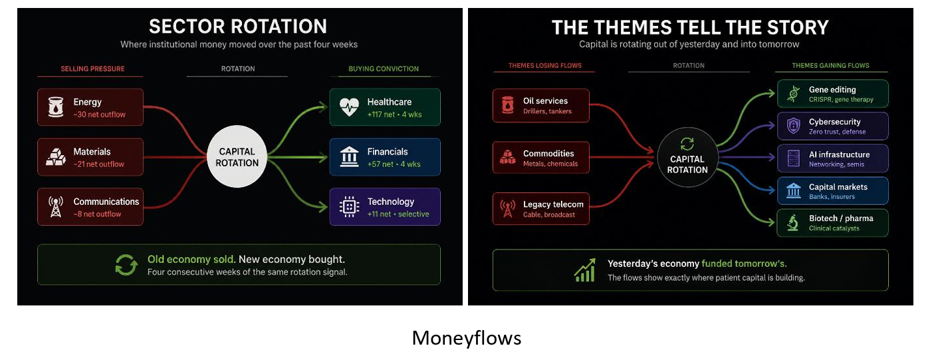
In retrospect, everything looks contained. But underneath, a 33-point performance gap emerged between the names institutions were buying and selling.
The April and May AI darlings – the names that led the sprint higher – have lost an average of more than 10% over the past two months. Conversely, the names receiving institutional inflows over that same period averaged a gain of nearly 19%.
Same market, same month, yet completely different outcomes, depending on which side of the flows you were on. In other words, it was the broadening we discussed last week.
That gap doesn't show up in any macro index. Most investors won’t notice. It only shows up if you're watching where the money went:
Furthermore, during this time there wasn’t much decay in MoneyFlows’ Big Money Index (BMI, a 25-day moving average of institutional investor activity). The trusty BMI held between 64%-65%, then began to tick up by the end of last week to almost 70%:
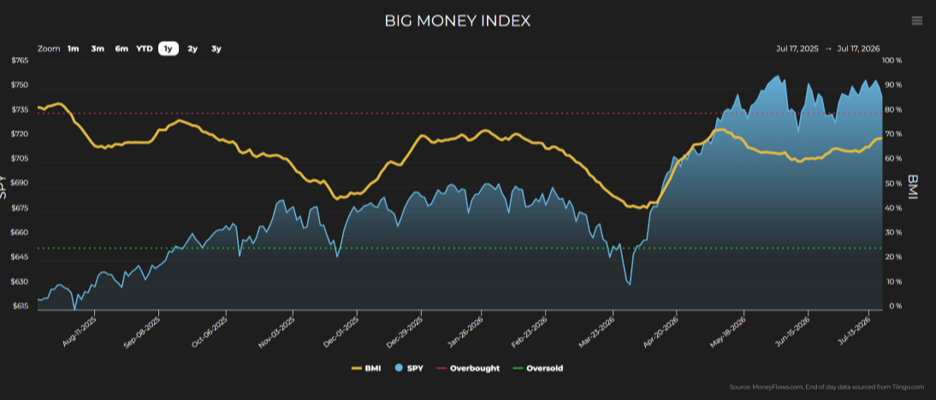
With all this rotation and daily volatility, digging slightly below the surface with the BMI showed no major cause for concern.
Why?
Because that’s not what a crumbling market looks like. This action looks like money quietly changing seats as it prepares for some extraordinarily positive fundamental data.
- Selling didn't explode:
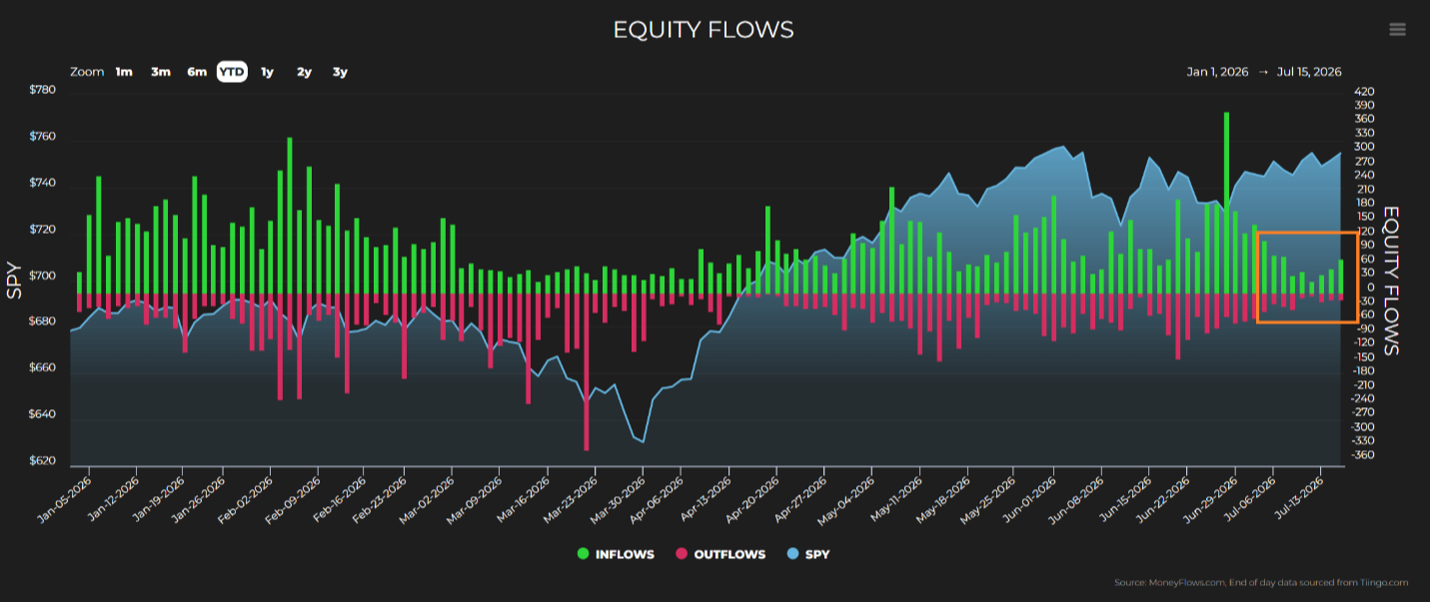
In fact, it slowed. At the same time, buying began to take a breather. But almost on cue, it ticked up before earnings season.
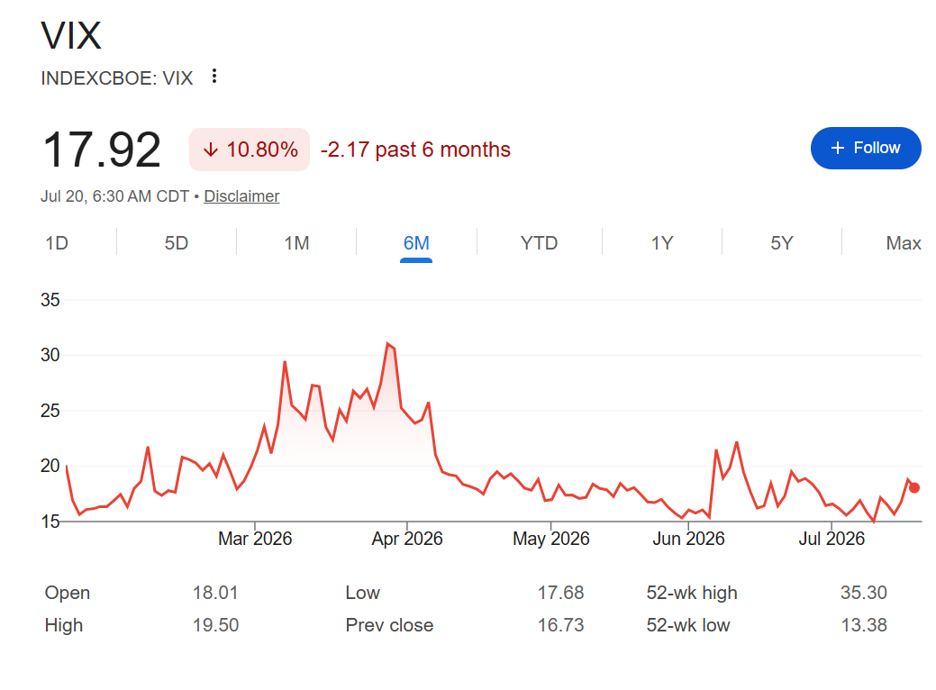
While an initial positive, we need to watch the next 5-10 trading days or so to confirm a full trend reversal. Even as the market seemingly gyrated day-to-day, the CBOE Volatility Index (VIX) – the market’s so-called “fear gauge” – settled between 16 and 18, which is lower than during the beginning of parabolic moves of April:
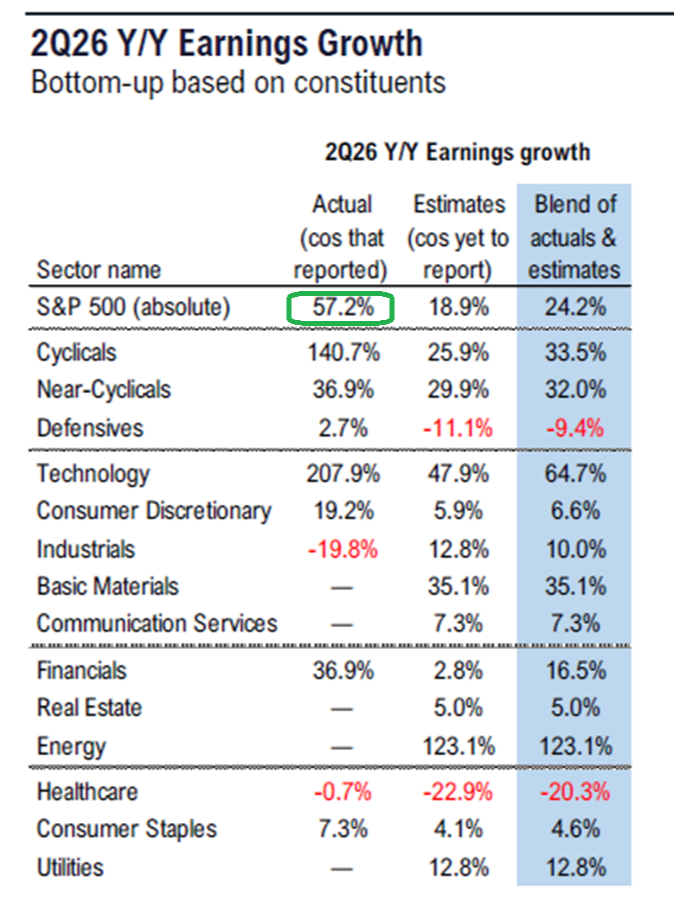
The money flow trend reversal coincided with initial earnings reports. Though the sample is small, year-over-year earnings growth for S&P 500 companies that have reported so far is over 57%:
Further historical clarity on Q2 earnings expectations when considering actual earnings outperformance compared to estimates. The consensus analyst year-over-year earnings growth rate estimate at the end of Q2 was a spectacular 23.6%:
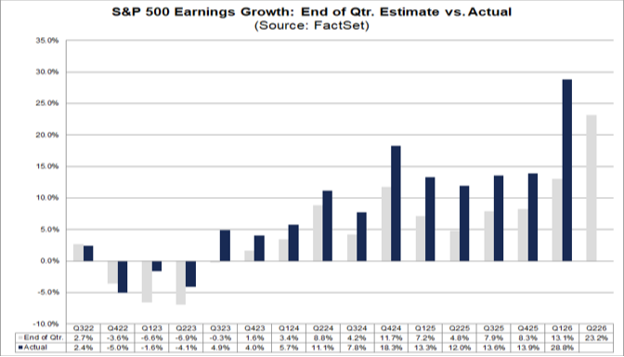
- Given historical beat rates (78% of companies habitually clear Wall Street's bar), the actual growth rate for future earnings could be near 30%. Here's the math over the past five years, per FactSet data.
Average outperformance over estimates: 7%.
Companies reporting actual EPS above mean estimates: 78%.
Average earnings growth rate increase from quarter end through earnings season end: 6.4% (thanks to the number and magnitude of positive earnings surprises)
Apply all this to the estimated 23.2% earnings growth rate and the actual earnings growth rate for the quarter could reasonably hit 29.6%:
23.2% initial estimate + 6.4% average increase = 29.6% earnings growth rate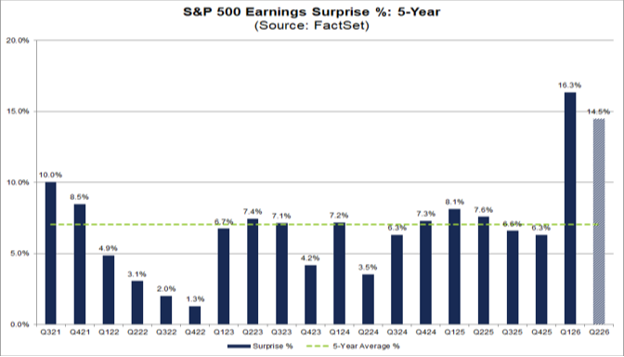
- The consumer price index reading was -0.4% in June, well below the expected -0.1%. More importantly, core CPI (which excludes food and energy) was unchanged. That’s significantly below the consensus expectation of a 0.2% jump:
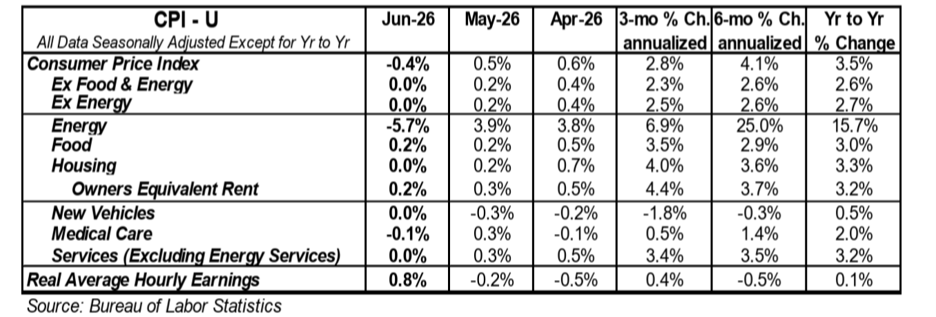
This is important because now core prices are up only 2.6% versus a year ago. This gives the Federal Reserve leeway to be patient with interest rate decisions and probably provides the market some certainty throughout the year.
Putting this all together as we look forward to the remainder of the summer and into early fall, we continue to have further clarity on a week-by-week basis. We believe this is positively supportive for the market as we prepare to enter the heart of Q2 earnings season.
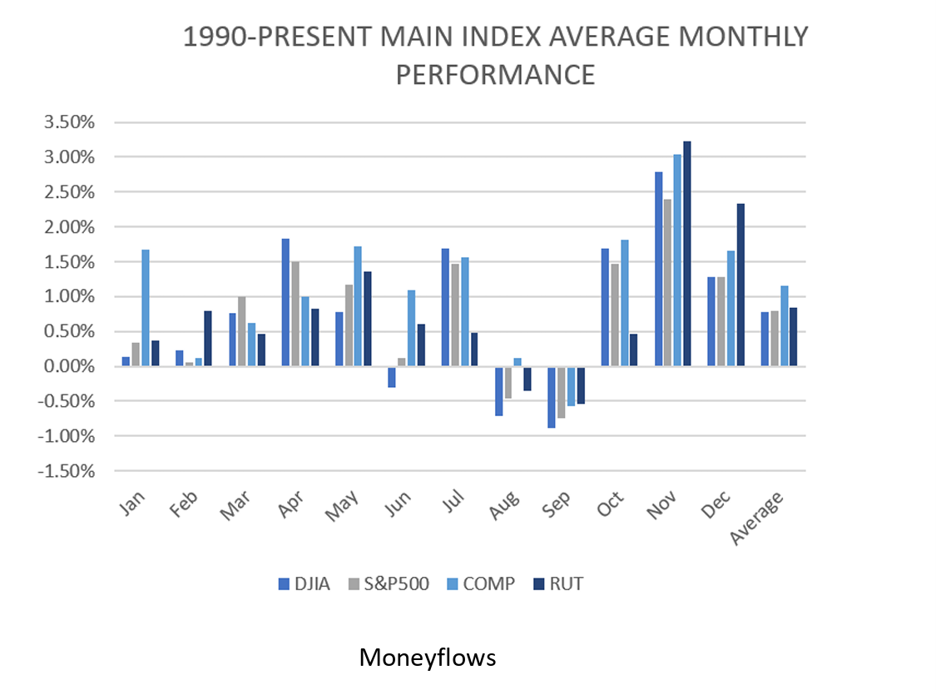
July has traditionally been one of the strongest months of the year, averaging gains of about 1.5% with positive returns roughly 2/3 of the time. To us, this is a clear historical reflection of July being a fundamental earnings report month.
Seasonally, we know August and September are different. Traders go on vacation and the summer doldrums hit.
Beating that dead horse once again, the seasonally slow summer combined with a midterm election year makes it perfectly reasonable to see the below pattern play out once again, albeit with potentially more pronounced weakness in August and September:
As we've said all year, investors miss that the fourth quarter of midterm years has been consistently strong, averaging 7% gains with an 88% positive rate since 1926. And since 1950, the S&P 500 has averaged a 36% one-year return off midterm election year lows.
As always, the market calendar has a way of rewarding patience. But it doesn't mean history always repeats. Even “healthy bull markets” pause because pullbacks shake out fast money, reset expectations, and create opportunities for investors willing to stick around.
We believe the data reflects that over the last month or so. The long-term themes haven’t changed:
- Earnings are breaking records.
- Inflation is cooling.
- Infrastructure is being built.
- Companies are spending heavily on power, networking, cooling, and semiconductors.
- Cybersecurity is one of the strongest areas of technology.
- Financials stocks are being bought, supported by surprisingly resilient consumers and corporations.
While the headlines are still focused on yesterday's loud money, underneath the surface, the patient money is waiting in the weeds for earnings and post-election clarity, right alongside us.
*Links to third-party websites are being provided for informational purposes only. CoreCap is not affiliated with and does not endorse, authorize, or sponsor any of the listed websites or their respective sponsors. CoreCap is not responsible for the content of any third-party website or the collection or use of information regarding any websites users and/or members.
*Past performance does not guarantee future results.
*Investing involves risk and you may incur a profit or loss regardless of strategy selected.
Securities sold through CoreCap Investments, LLC. Advisory services offered by CoreCap Advisors, LLC. Cornerstone Financial and CoreCap are separate and unaffiliated entities.