

As of today, the U.S. attack on Iran is in its 16th day, and since it started, the S&P 500 is down about 2.5%. At Cornerstone, our current opinion is it’s likely this conflict will last longer than popular consensus expectations of a short, in-and-out war.
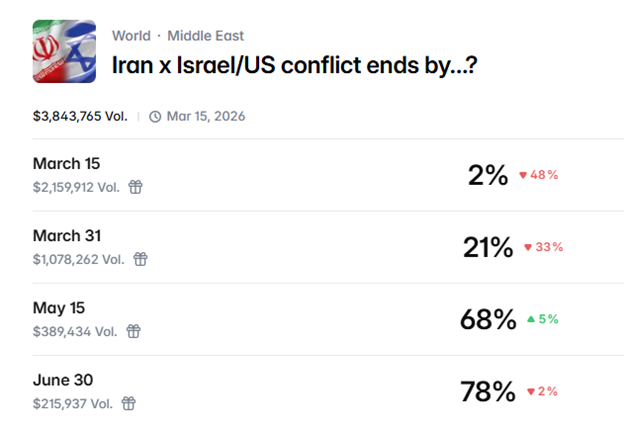
Perhaps the best leading indicators supporting this are prediction markets, which currently have a 78% highest probability for this conflict ending at the end of June:
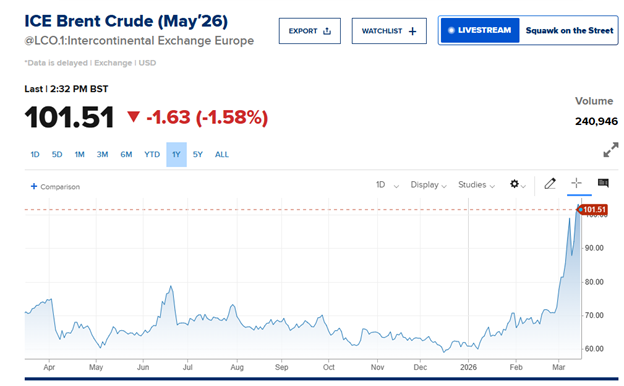
In other words, we think it’s prudent to plan for the conflict to last through the next few months. That’s also a realistic timeline to expect the speed of Brent crude oil futures dancing around or above the all-important $100-a-barrel price we detailed last week.
As you can see, the current futures price expectation through the end of May is just over $100 per barrel:
Despite this spike, we expect the effect on U.S. economics and markets to be muted in comparison to the current popular headline narrative. You're surely wondering why we’d take a more positive contrarian position today. I’ll explain.
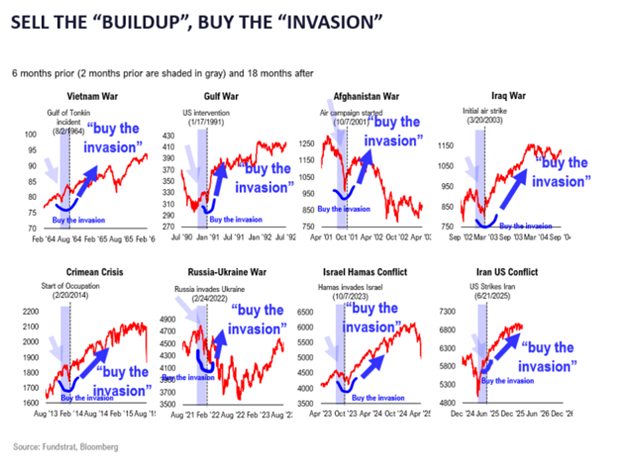
1. Stocks tend to rally after war commences, following the adage, “Sell the buildup, buy the war.”
2. Higher oil prices are the major impacts of this conflict globally.
Oil prices will rise. But we think the U.S. will also benefit from those higher oil prices. Since 2020, the U.S. has been a net exporter of oil:
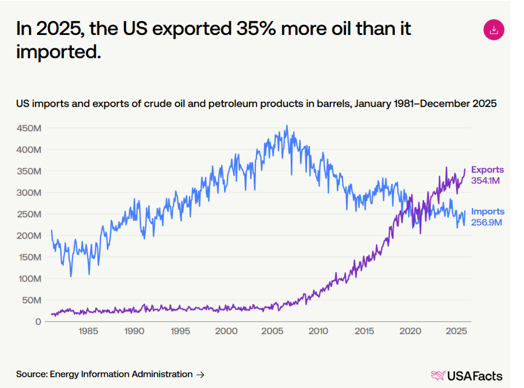
Higher oil prices equal a boost to the overall economy.
3. The U.S. economic benefit is significant relative to the economic pain for others. China and others in Asia and Europe are hurt the most by the closure of the Strait of Hormuz:
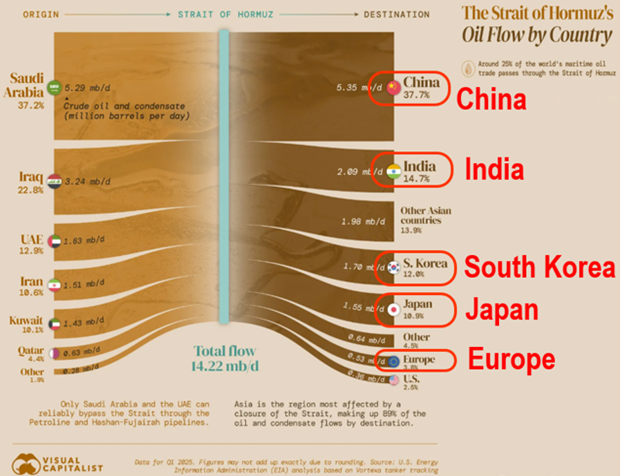
Meanwhile, the U.S. has the least amount of major oil traffic through the waterway.
4. U.S growth stocks should benefit from slower global growth.
While global growth will likely slow, it means investors will begin to favor U.S. growth stocks.
5. The U.S. has the “Trump put.”
This administration is highly cognizant of the fact that higher gasoline prices are not popular, especially with midterm elections around the corner.
We’re already seeing this playing out. The administration indicated the U.S. Navy will be made available to escort tankers through the Strait of Hormuz.
Also, the U.S. government has already stepped in to fill the insurance gap for tankers as Lloyd’s of London stopped insuring vessels when this conflict began.
Frankly, we’re already seeing this view bear out. Since the war started, European stocks are down over 6%, Japanese stocks are off 7%, and Indian equities fell 11%. But the S&P 500 is down just 2.5%.
While investors remain skeptical of the possibility of any upside given the risk of war, we think it’s more likely that markets will climb a “wall of worry,” just as they have time and again historically.
But don't take our word for it. Zooming out over the last 126 years, you can see numerous events felt “like the end of the world” only to end up being a blip on the market’s radar:
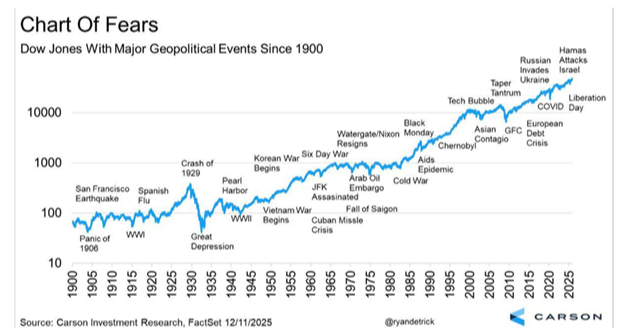
The real silver lining is that historical data tells us bull markets climb these “walls of worry” because when no one's worried, the crowd is already all-in. And that’s when rallies falter as demand dries up due to investor euphoria.
To paint this picture more clearly, let’s unpack a couple of contrarian datasets to support this outlook.
Economic Uncertainty
The U.S. Economic Policy Uncertainty Index measures macro headline risk based on many data points, including news coverage, Congressional Budget Office reports, economic surveys, and more. With recent geopolitical worries and AI disruption fears, it's no wonder economic uncertainty is at its highest level since the height of the tariff tantrum panic last year:
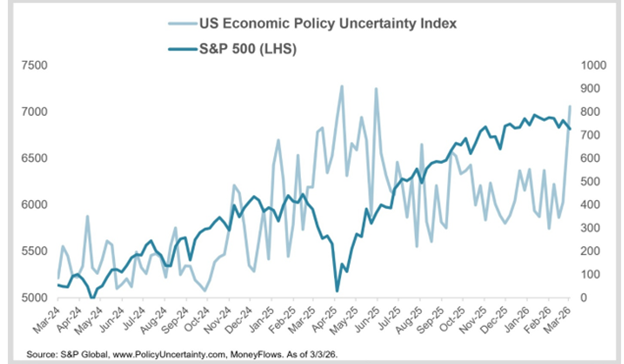
This spike in uncertainty has played a significant part in pausing the S&P 500 rally so far this year.
But as we've been saying for months now, index performance doesn’t tell the entire story. We’ve proven the huge dispersion underneath the market’s surface between winners and losers. Stock leadership has rotated into our recommended overweight sectors like materials, industrials, energy, utilities, and so on.
Clearly, the 2025 laggards are up significantly, even as the S&P 500 has done nothing:
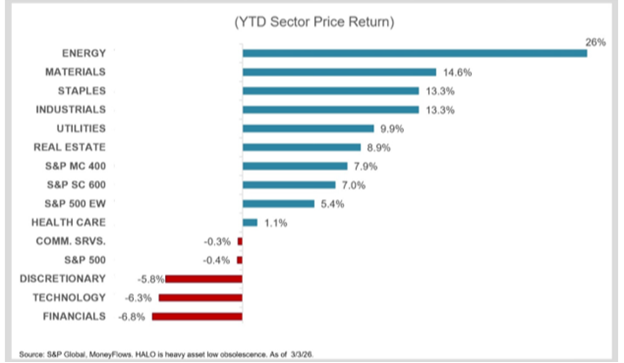
Markets have been rewarding real world physical capacity and heavy asset businesses as the new equity leadership theme. But investors still with high uncertainty are getting spooked out of the market as stocks have swung wildly.
Thankfully, objective data provides us the contrarian clarity to avoid this emotional trap.
For instance, we analyzed how equities perform after periods of elevated uncertainty going back to 2000. Interestingly, it turns out that uncertainty is actually a contrarian buy signal:
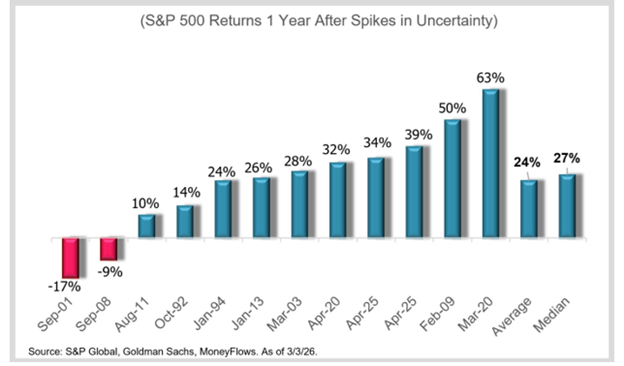
The S&P 500 averages outsized gains of 24% a year after the top decile readings in the Economic Policy Uncertainty Index. Thus, elevated economic uncertainty isn’t a prudent reason to abandon equity markets.
Credit Risk
Another set of data supporting this contrarian view comes from credit markets. Keep in mind that bear-istas’ big concern is that AI investment spending has risen to levels that will harm corporate balance sheets and create new credit risks.
Credit spreads measure the premium companies pay above comparable Treasury yields to borrow money. Higher credit spreads are an indication that bond markets are assigning increased risk to corporate balance sheets and earnings.
But here's the problem with the bear-ista case: credit spreads are at near record tight levels, at just 88 basis points above Treasurys:
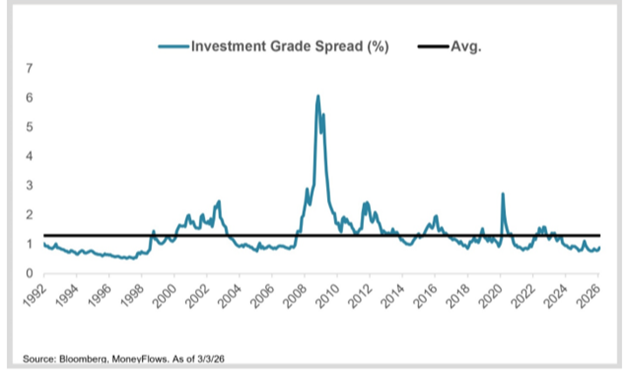
That is significantly below the long-term average of 130 basis points.
Why does this matter?
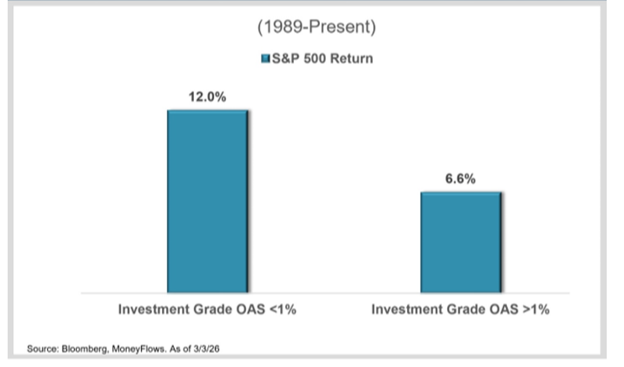
From a historical perspective, stocks significantly outperform when credit spreads are below 1%. This makes sense because tight spreads reflect bond investors’ high confidence in the health of corporate America (earnings, earnings, earnings – earnings always matter).
For perspective, since 1989 the S&P 500 has gained 12% in the year following sub 1% investment grade spread ratings versus only 6.6% average advances when those credit spreads have been above 1%:
Even more importantly, stocks are significantly less volatile in sub 1% credit spread environments. The biggest S&P 500 drawdown was only 20% in these environments versus a maximum drawdown of 69% when spreads were over 1%.
Remember, good decisions are made when you follow the data instead of the crowd.
* Links to third-party websites are being provided for informational purposes only. CoreCap is not affiliated with and does not endorse, authorize, or sponsor any of the listed websites or their respective sponsors. CoreCap is not responsible for the content of any third-party website or the collection or use of information regarding any websites users and/or members.
*Past performance does not guarantee future results.
*Investing involves risk and you may incur a profit or loss regardless of strategy selected.
Securities sold through CoreCap Investments, LLC. Advisory services offered by CoreCap Advisors, LLC. Cornerstone Financial and CoreCap are separate and unaffiliated entities.