

It’s clear that 2026 is proving to be the year of broadening rotation and heightened volatility, as we at Cornerstone predicted to be the case during a midterm election year. This environment isn’t as disconcerting for us at CFS because an evidence-based research approach provides the game plan for us to follow when markets gyrate.
Last week layered a third level of uncertainty with the latest geopolitical setback rooted in the U.S. war with Iran. Once bombs dropped, volatility surged and stocks plunged.
With that in mind, today we want to explore and analyze a new and real risk resulting from this recent geopolitical uncertainty. We also want to dissect what history suggests we should expect looking forward.
In February, we spent most our time discussing “hypothetical fears” that were driving market volatility. As the calendar turned to March, volatility spiked because of an actual event when the U.S. attacked Iran.
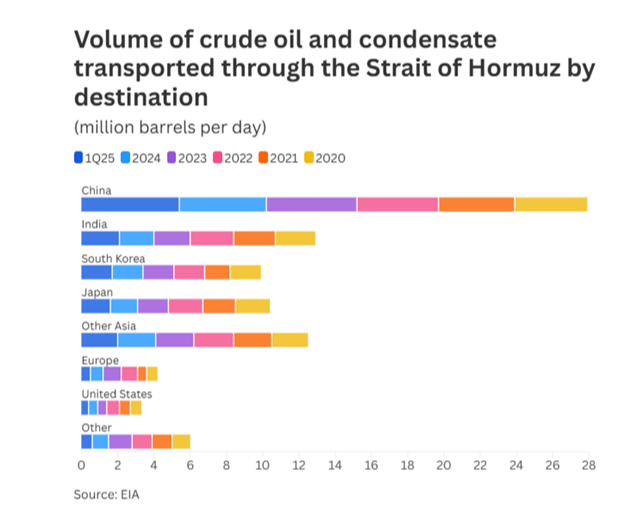
The most important short-term risk this brings to the forefront is one of Iran’s retaliatory efforts when it closed the Strait of Hormuz. This is important because about 31% of all seaborn Crude passes through this straight. So, energy and stock markets were jolted.
This fear that the oil supply could be threatened sent Brent Crude oil prices to over $95 per barrel (as of this morning):
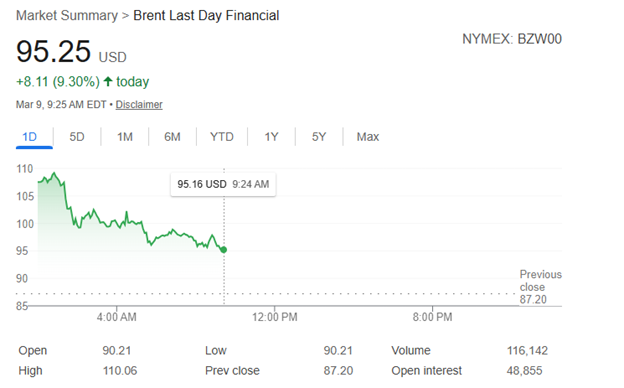
These levels haven't been seen since June ‘22. This matters because the concern is that higher oil prices will raise prices for other commodities and increase inflation. This is especially true for the nations most affected by the recent geopolitical events.
For perspective, keep in mind the January consumer price index came in at a comfortable 2.4% year-over-year. Prior to the initiation of this war, the February forecast for CPI was 2.41%. But historical data illustrates a tight correlation between Brent crude spikes and CPI:
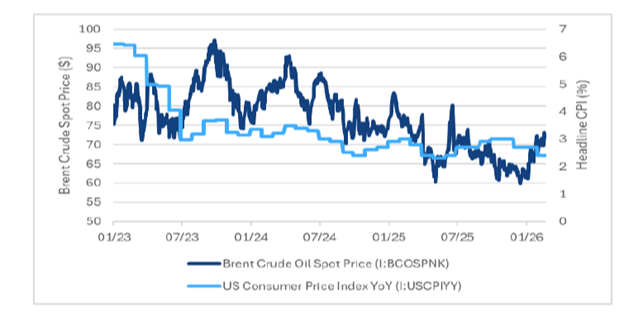
Specifically, there's a 0.7 correlation between oil spikes and CPI. This visually demonstrates that for every $10 increase in oil prices, typically approximately 0.2% is added to inflation.
We've already seen Crude increase by about $30 per barrel since the current conflict began. For us, extended conflict introduces a risk of Brent Crude reaching $100 per barrel, creating the potential for CPI to breach the all-important 3% threshold.
From an equity market standpoint, if that inflation rise was to take place, it would be much harder for the Federal Reserve to justify cutting interest rates, regardless of how dovish the incoming Fed chair is.
This is reflected in comments made last Tuesday by the Minneapolis Fed President Neel Kashkari to Bloomberg:
“Now we need to see what this new shock, potentially new shock hitting the global economy. How long is the effect, and how big is the effect?”
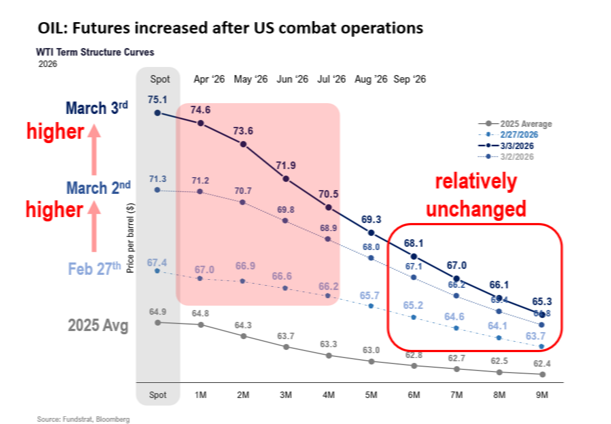
In the short term, the question we’ll be trying to discern is whether this is a good time to buy the dip or if the dip will keep dipping. The good news is that over the past five years, investors who went with the “buy the invasion and sell the rumor” playbook have quickly profited.
As we sit here today, we believe that is the more likely scenario. As you can see, the long-term oil futures outlook has remained relatively unchanged:
That said, how do data and history guide us in regard to the game plan moving forward?
The circle below shows the immediate market sell off early last week as a result of the war:
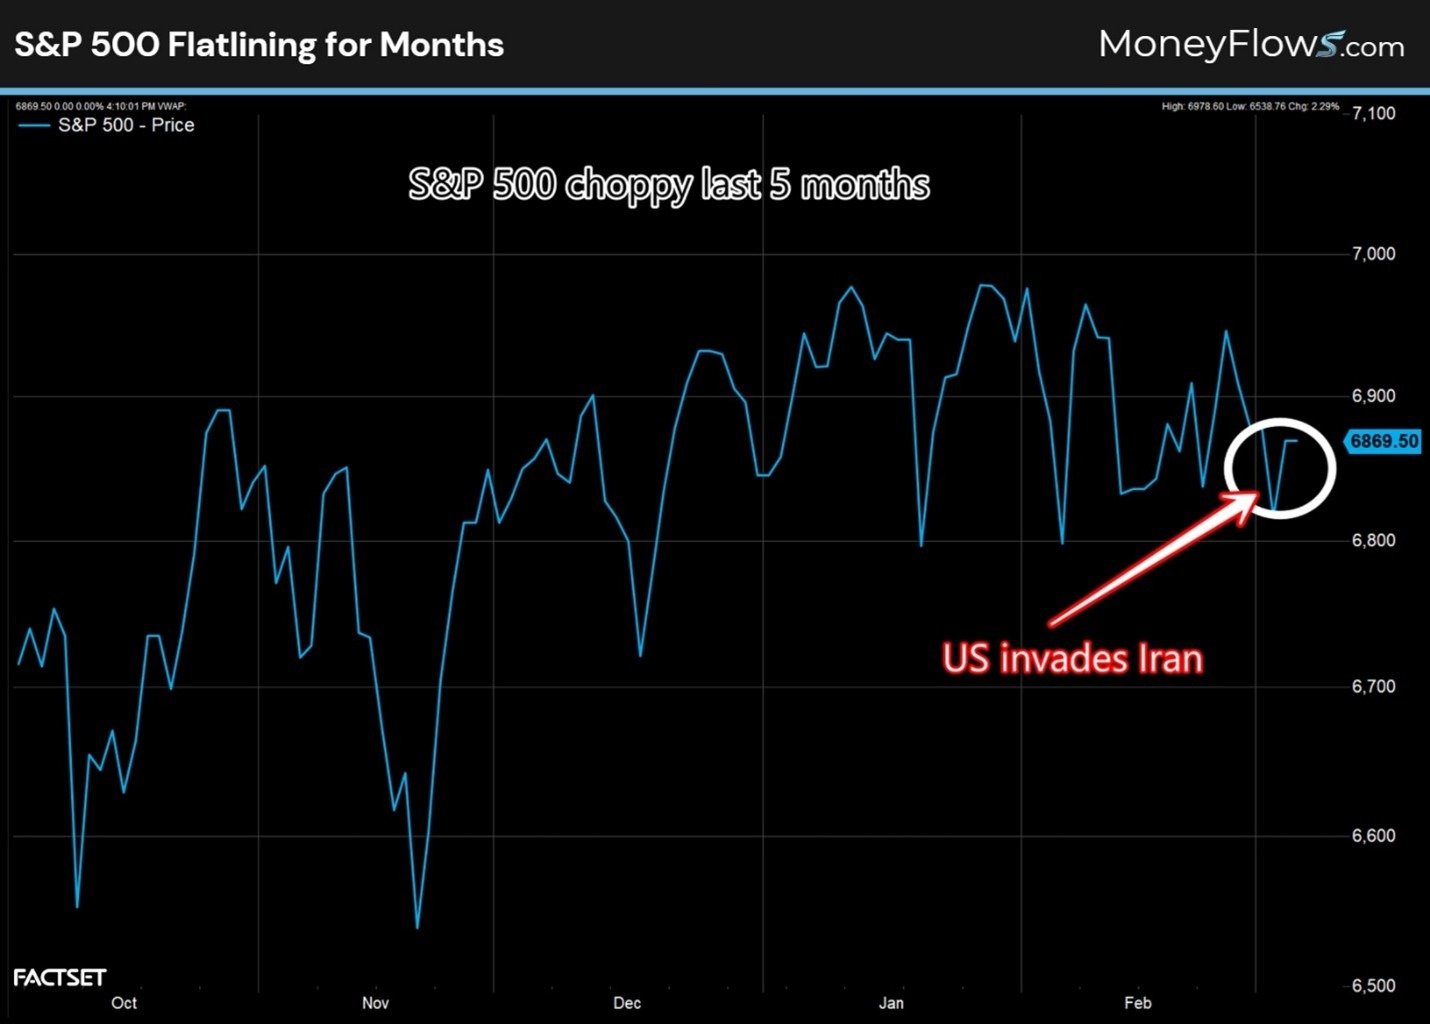
It's easy emotionally to think that moving to cash is the best option. However, history suggests that is a mistake.
Here is a long list of major geopolitical events going back to 1979 and the forward returns for stocks:
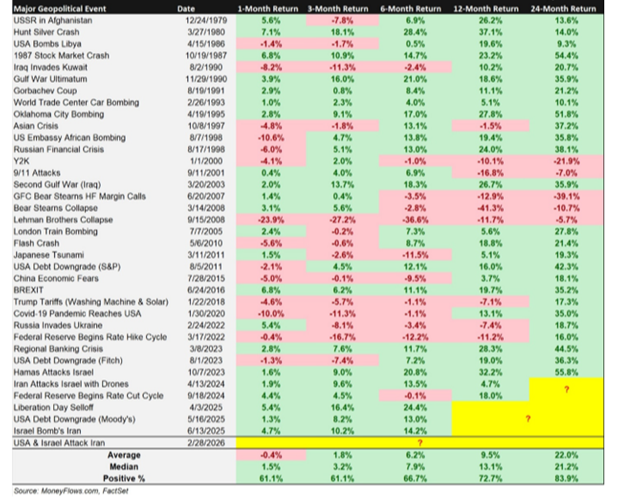
After major geopolitical events, the S&P 500 averages a one-month return of -0.4%, 1.8% after six months, 6.2% at six months, 9.5% after a year, and 22% after two years. From a historical perspective, near-term returns are muted, though these events are often shrugged to the side quickly.
So, don’t bail on stocks because of international conflicts. But also be prepared for heightened short-term volatility surrounding these events.
As of today, we have now seen the CBOE Volatility Index (VIX), known as the market’s fear gauge, hit multi-month highs of 31.18:
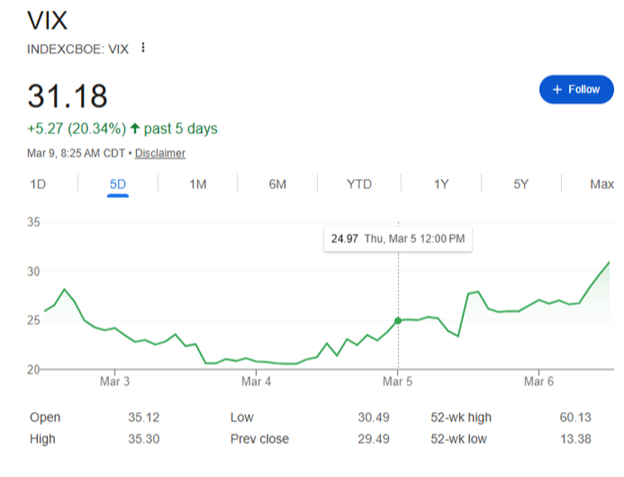
When the VIX moves around like that, stocks can drop quickly, as they did last week. But there's a hidden positive in this story.
Since 2015, when the VIX closes above 23.5 (as it first did last week), the forward S&P 500 returns are extraordinarily positive:
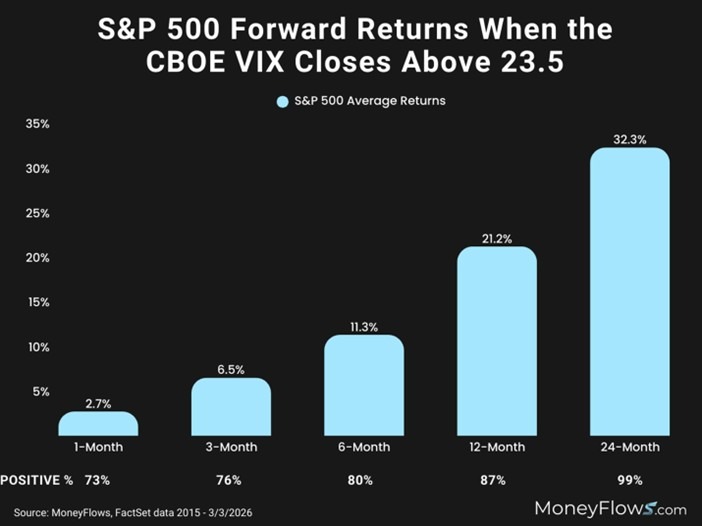
From one month to two years, returns are positive.
Digging just a bit more, market history also tells us that dividend growth stocks massively outperform during S&P 500 volatility and corrections (like now).
Since 1975 during S&P 500 corrections of 10% or more, dividend payers outperform the average stock by 5.5%:
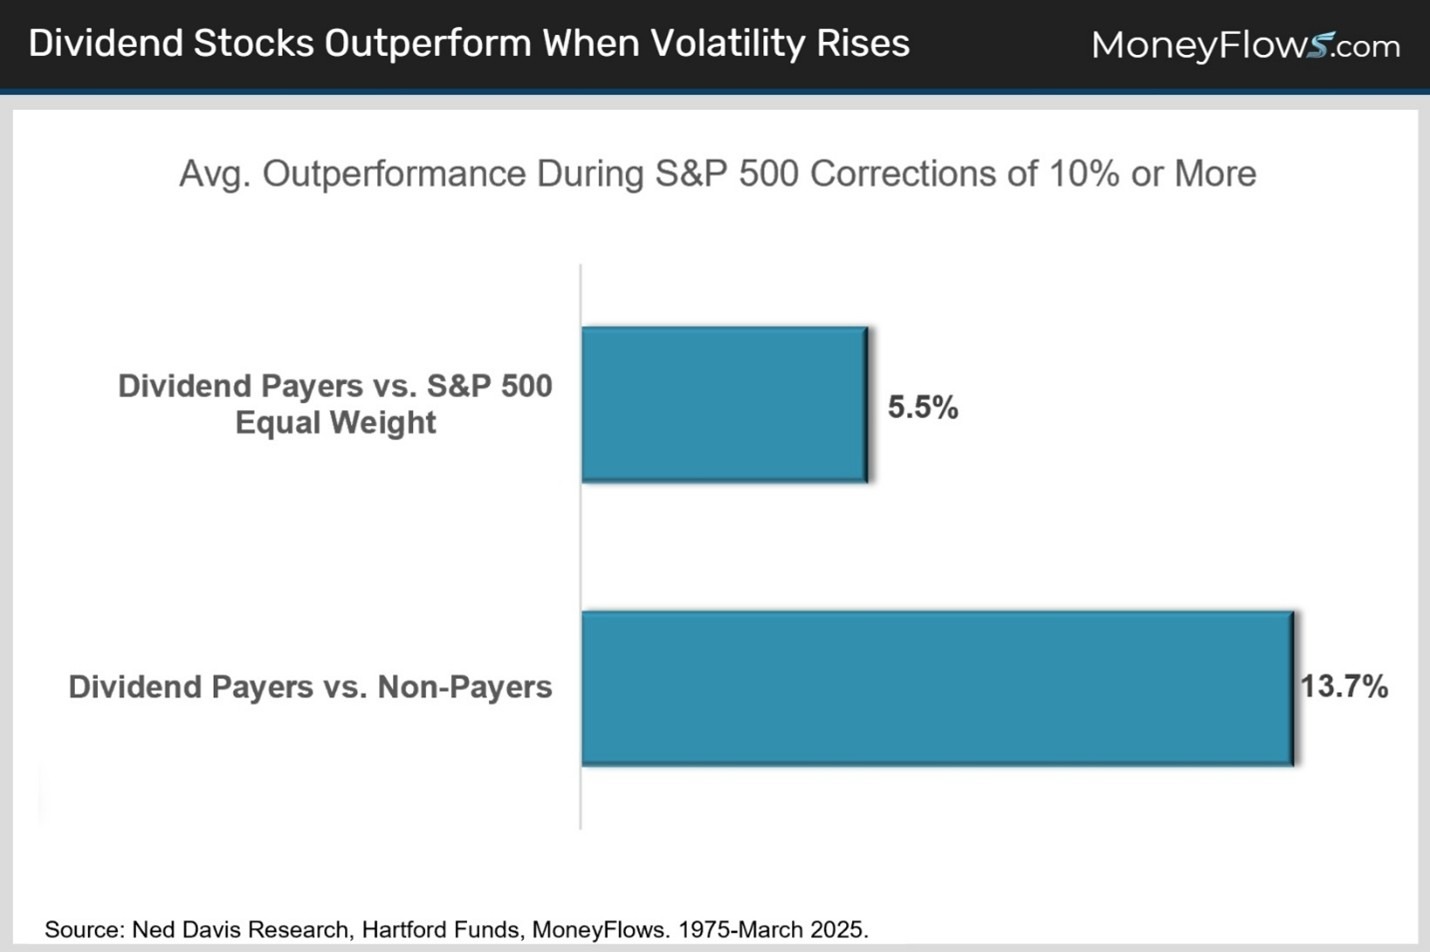
Even more striking is the fact that dividend payers outperformed non-payers by 13.7%.
We're seeing this dynamic reflected in our own flagship dividend growth model strategy. As of this writing, it’s up 10.7% on the year, even in the face of heightened uncertainty.
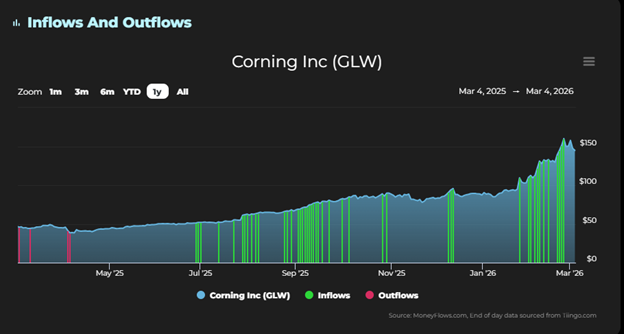
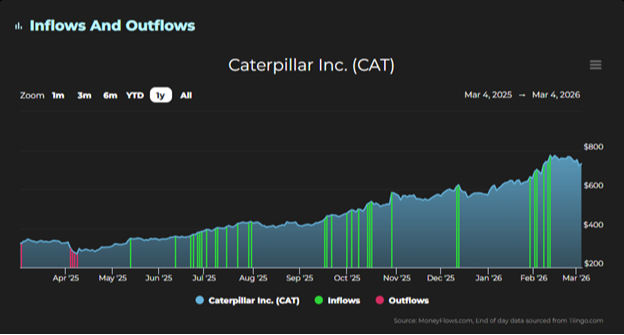
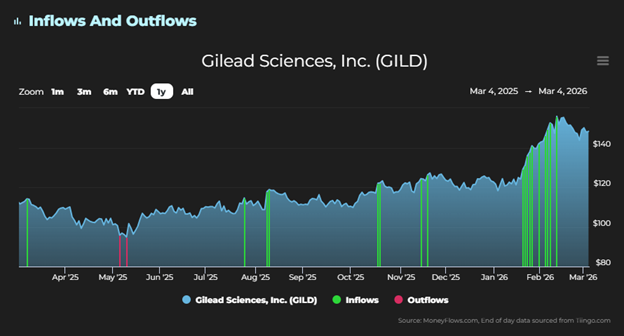
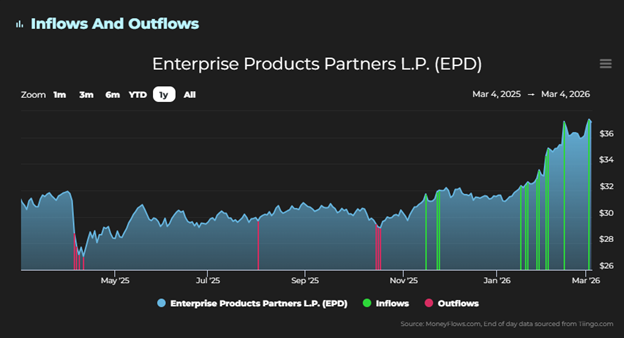
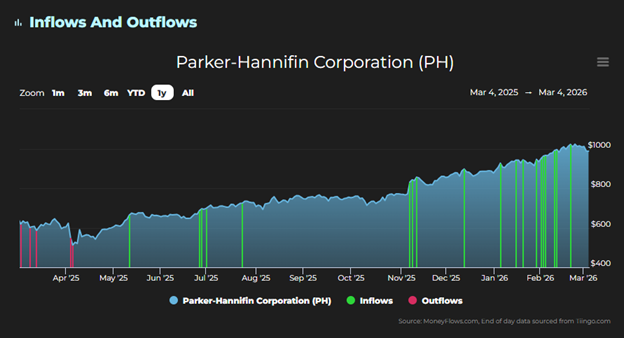
Clients and long-term readers know that investing in dividend stocks is not a new idea for us philosophically, whether in 2026 or otherwise. We’re seeing clear winners supported by institutional buying data that gave us advanced indications of this spike in strength of dividend paying stocks.
For example, as you can see in the following charts, a handful of the positions* held in our dividend growth model have been heavily supported by institutional inflows. Look no further than the flurry of green lines on the right side of each chart.
So there you have it. While currently uncomfortable, don't emotionally overreact to geopolitics because markets tend to recover fairly quickly in the months to come. These are the times it is vital to stick to the long term plan founded in data and historical precedent.
* Links to third-party websites are being provided for informational purposes only. CoreCap is not affiliated with and does not endorse, authorize, or sponsor any of the listed websites or their respective sponsors. CoreCap is not responsible for the content of any third-party website or the collection or use of information regarding any websites users and/or members.
*Past performance does not guarantee future results.
*Investing involves risk and you may incur a profit or loss regardless of strategy selected.
* GLW, CAT, GILD, EPD, and PH are owned in client accounts. Daniel Milan owns GLW and EPD personally.
Securities sold through CoreCap Investments, LLC. Advisory services offered by CoreCap Advisors, LLC. Cornerstone Financial and CoreCap are separate and unaffiliated entities.