

On Wednesday, equity markets fell sharply after Federal Reserve Chair Jerome Powell's commentary. Losses ranged from 3%-5% across all major indices.
The reason for this reaction is the Fed forecasted one less interest rate cut for 2025 than previously expected (two rather than three).
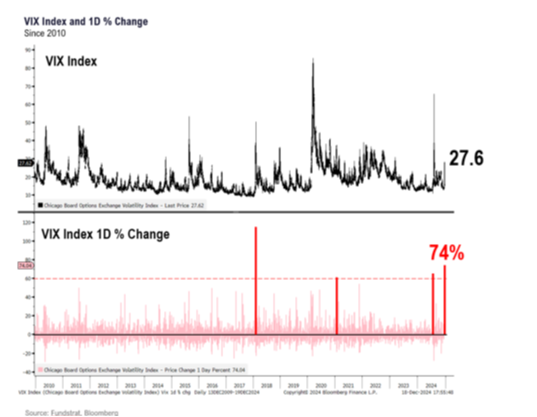
Of course, this created across-the-board panic. The madness included a 10-basis-point rise in the 10-year Treasury yield, the CBOE Volatility Index (VIX)* surging 74% (from 20 to 28), the S&P 500# falling 3%, and the Russell 2000^ dropping by 5%.
We at Cornerstone think this emotional reaction was the result of two statements made by Fed Chair Powell that caused markets to de-risk:
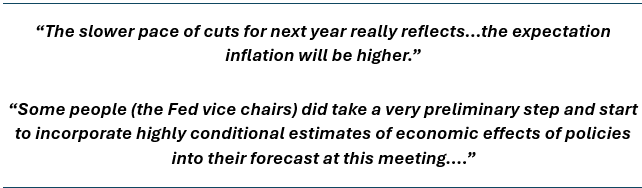
So, he said some folks at the Fed see higher inflation in 2025 because of the potential inflation impact stemming from a new administration in the White House. In other words, politics.
Still, Powell deems these uncertainties valid enough to consider a potential slowing of rate cuts.
Investors Don’t Like Change
In our view, the sharp de-risking reaction was because investors don’t like change. To be clear though, we think actual inflation continues to undershoot the Fed.
So, is this a short-lived, panicked reaction? Or is it a fundamental change to the market outlook?
In our opinion, this reaction was emotional and short-lived for four reasons.
First, the spot VIX rose 74%, which was the second highest spike ever:
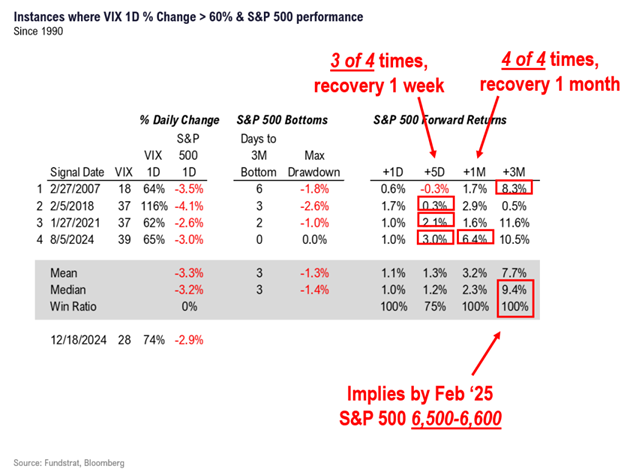
But what’s really notable is how quickly markets recover from similarly volatile selloffs. In 75% of instances since 1990, the S&P 500 recovered fully within a week; it recovered every time within a month:
Second, there was clear capitulation on Wednesday. It seemed no asset class was safe. For stocks, every sector experienced an over 90% down day – more on that later.
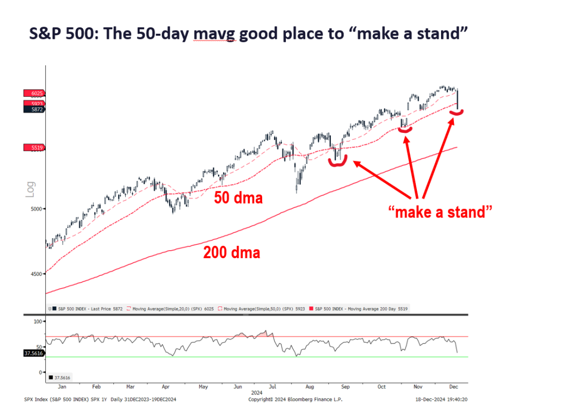
Third, the S&P 500 tested its 50-day moving average, bouncing strongly off this resistance level:
Lastly, we believe investors will ultimately conclude that the Fed is still dovish overall, even with less visibility into the specific ups and downs that will unfold in 2025.
This is supported by the fact that the Fed still sees the long-term federal funds rate getting to 3%, which is essentially the same as the 2.9% it showed in September 2024:
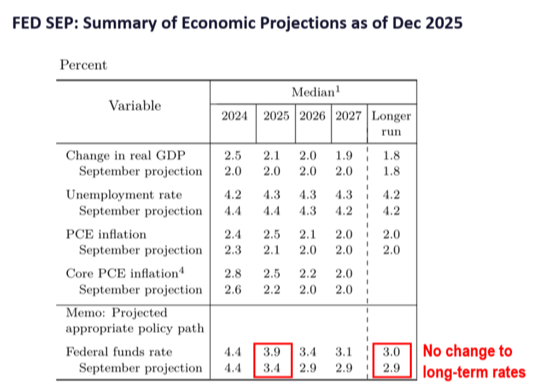
So, there are still about 150 basis points of cuts to be realized in the future. Our conclusion is the Fed merely wants a longer cutting cycle to hit an ultimate goal that hasn’t really changed.
Forced Selling Events Are Part of Trading
The reasons above alone would support a “buy the dip” mentality. But let’s revisit capitulation.
When we dig into the rare capitulation data that came out of Wednesday, it provides further support for this being a short-term emotional reaction.
While never fun, we should all know that forced selling events are part of trading. Our readers only need to rewind the tape back to August, when we saw similar action.
So to put Wednesday into perspective, the intense drawdown amounted to a 3.2% buy day – or rather, that 96.8% of “big money” investor signals were sells. Only 11 stocks were accumulated and 334 were liquidated.
If visuals are more your thing, you can see in this chart how Wednesday’s performance compares to prior similar capitulation events:
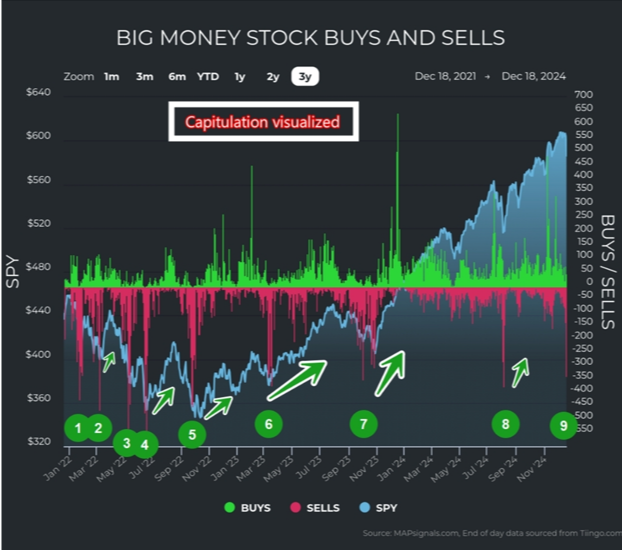
Rarely do we see broad weakness like this. But most importantly, these extreme periods usually don’t last too long.
Thus, emotional reactions to market movements like this are always short-sighted.
As we at CFS were digging into the situation, we noted how truly broad the weakness was Wednesday. Every single sector felt the wave of money exiting portfolios:
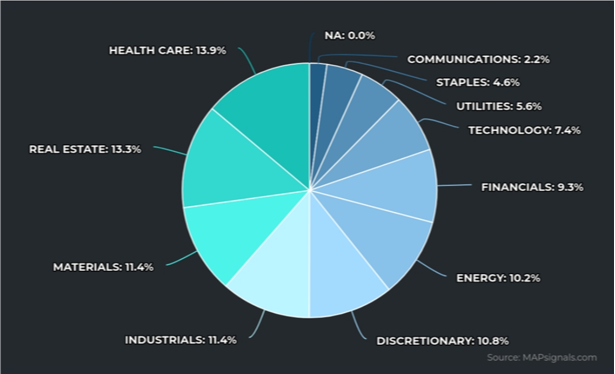
Again, this level of breath is indicative of emotional decision-making, rather than targeted, fundamental liquidations. The latter would almost certainly be more strategic and deliberate.
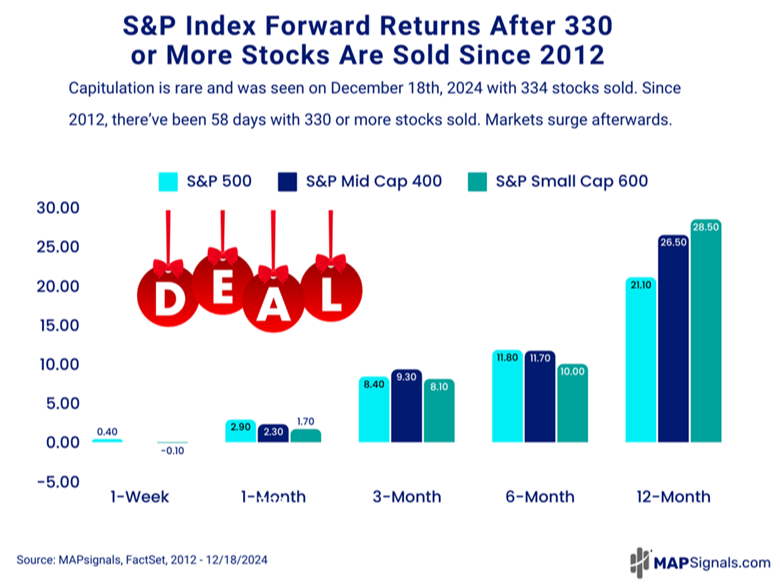
Looking back to 2012, there have been 58 days when 330 stocks or more were sold like this, and it helps inform us of what might be next. For the curious, history has been consistent on this – we’ll probably see a powerful rally.
As this chart shows, when 330 stocks or more were sold in a day, three months later the S&P 500, S&P MidCap 400+, and S&P SmallCap 600& all jumped at least 8%. A year later, they were all north of 20%:
Bringing all this data together provides us with crucial insight. It’s the kind of knowledge that keeps you from falling into a trap, like many did earlier this week.
At CFS, we’ll aim to avoid emotionally charged, short-term traps by being disciplined, sticking to the plan, and buying the dips along the way.
* Links to third-party websites are being provided for informational purposes only. CoreCap is not affiliated with and does not endorse, authorize, or sponsor any of the listed websites or their respective sponsors. CoreCap is not responsible for the content of any third-party website or the collection or use of information regarding any websites users and/or members.
*Past performance does not guarantee future results.
*Investing involves risk and you may incur a profit or loss regardless of strategy selected.
* The CBOE Volatility Index is a measure of the short-term volatility of the S&P 500 indexes, indicating how quickly market sentiment changes and the level of investor confidence or fear in the market.
# The S&P 500 is an unmanaged index of 500 widely held stocks that is generally considered representative of the U.S. stock market.
^ The Russell 2000 Index is a stock market index measuring the performance of the 2,000 smaller companies in the Russell 3000 Index and is widely regarded as a bellwether of the U.S. economy.
+ The S&P MidCap 400 tracks 400 companies that broadly represent companies with midrange market capitalization.
& The S&P SmallCap 600 is an index of small-cap stocks tracking a broad range of small-sized companies that meet specific liquidity and stability requirements.
Securities sold through CoreCap Investments, LLC. Advisory services offered by CoreCap Advisors, LLC. Cornerstone Financial and CoreCap are separate and unaffiliated entities.