

Recent volatility in the market rattled some investors. And while it was somewhat chaotic, it didn’t get us at Cornerstone too worried. That’s a good thing since this blog took last week off, and if there was a post, it probably would’ve been too calm for some people’s liking (and they wouldn’t have believed us anyway).
As we sit here today, probabilities favor the worst of August being behind us.
By the worst, we mean the S&P 500* fell to 5,119 on August 5. That doesn’t mean markets will ascend in a straight line from here – market bottoms are a process (keep that in mind when reviewing this post’s data).

Crucially, there have been some important incremental positive developments recently:
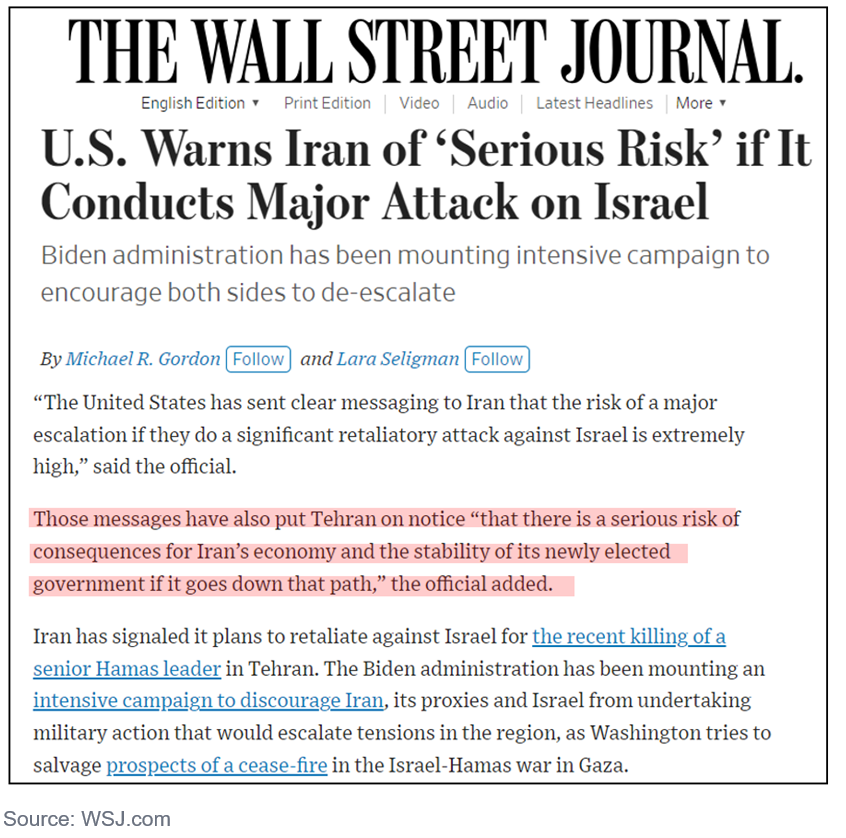
- Iran war risks seemingly pushed out
- Normalization of the CBOE Volatility Index (VIX) to less than 20
- The Japanese yen carry trade panic subsiding
- Another positive consumer price index report
Of those four, let’s dig into the rationale on why the core CPI, which excludes volatile prices of food and energy, specifically matters so much.
There was actually another leading indicator of decreasing inflation in the core producer price index released the day before (the PPI reflects prices paid by producers of goods). It fell 0.05% month-over-month, which was well below the consensus expectation of a 0.19% increase:
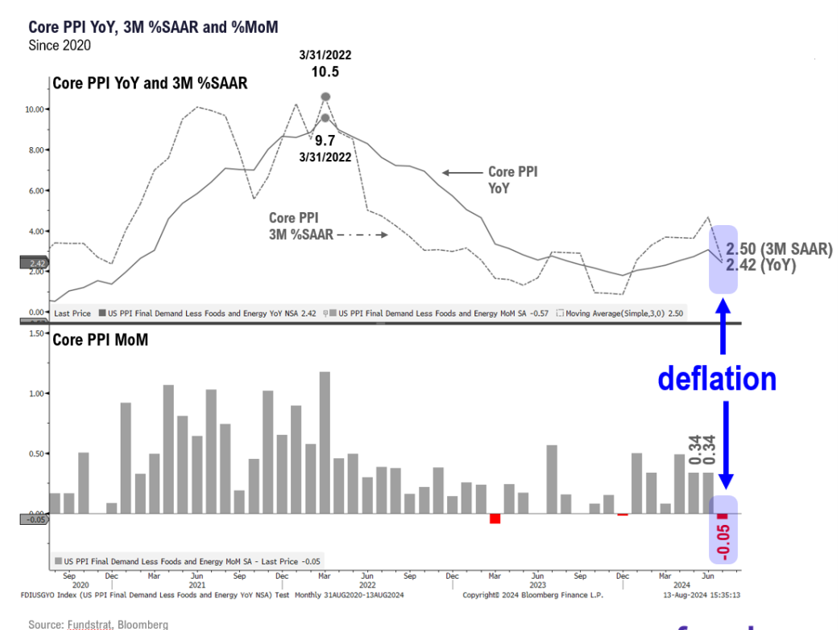
The falling PPI and positive CPI provide further support for deflation not just in July, but also in the months moving forward. Higher gas prices were already baked into the July CPI, so there were no surprises for investors. In short, inflation continues to fall like a rock.
It’s also important to note that there’s been little increase in margin debt usage:
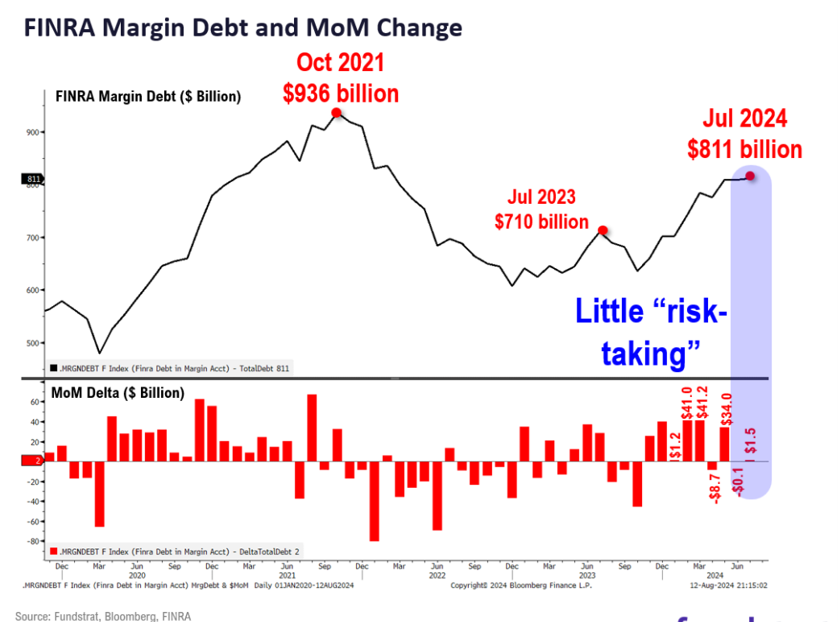
Investors have been de-risking for some time now. In fact, the past two months are the opposite of the massive deleveraging we saw from July to October last year, when the S&P 500 fell 11%. This time around there is less downside risk because of less margin debt overall.
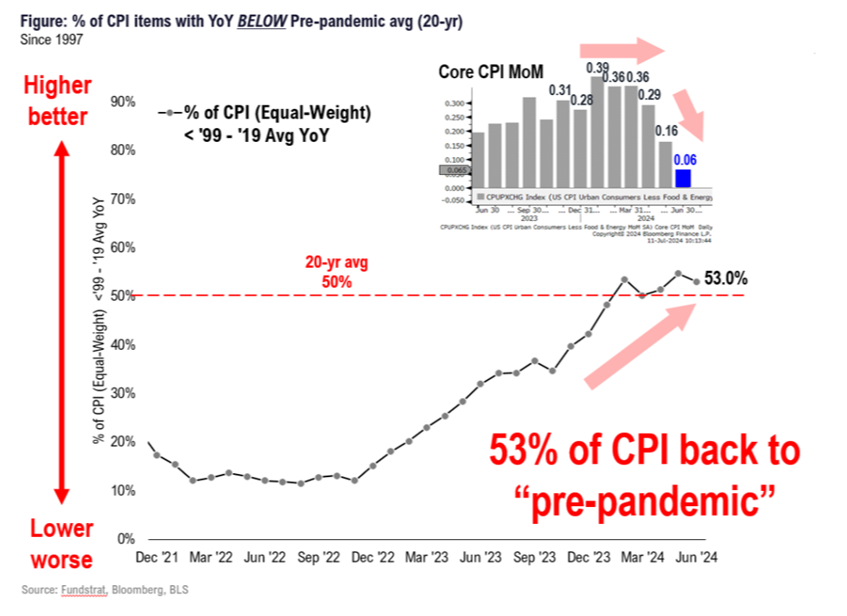
Turning back to inflation, the CPI increased just 0.2%:
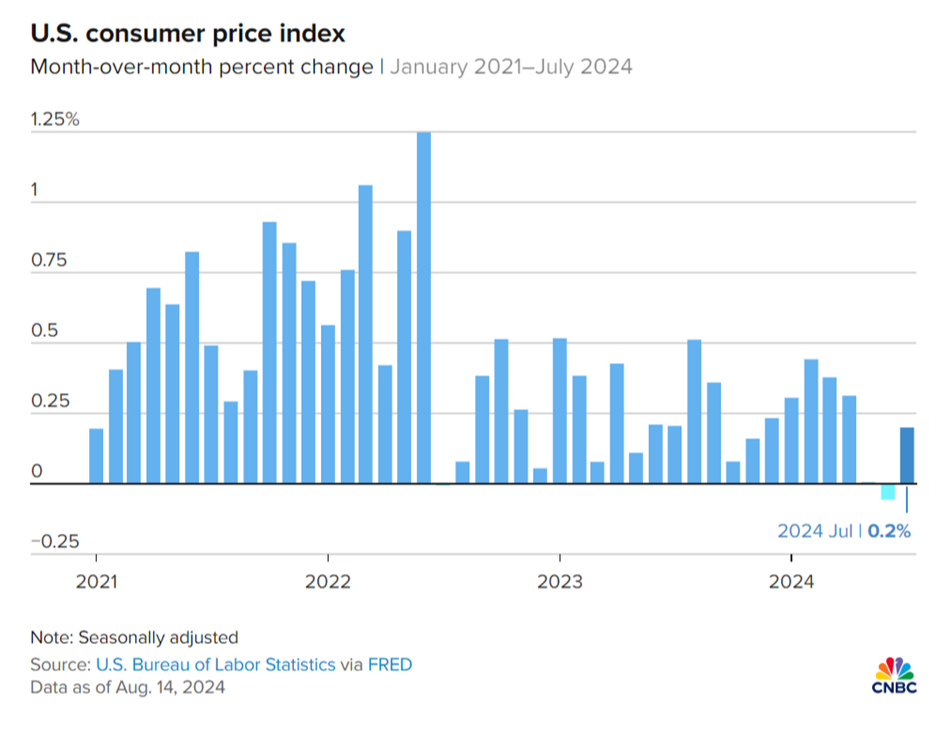
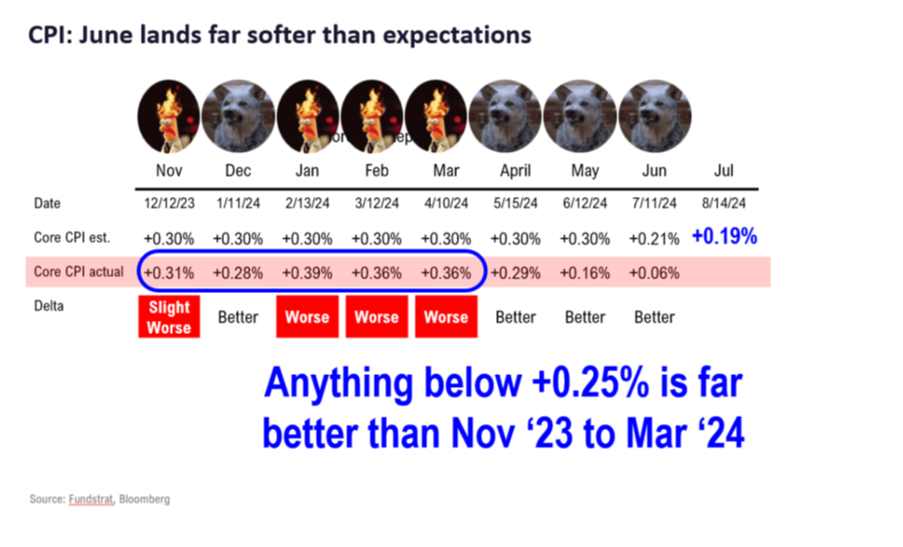
It’s the fourth soft reading in a row:
Not to sound like a broken record, but the “stickiest” components remain shelter and auto expenses. Again, higher gas prices were already priced in due to foreseen increases resulting from summer travel. Thus, they’re not worrisome.
That said, we will continue to monitor elevated shelter and auto prices. Of the excess inflation, shelter and auto account for almost 1.6% of it:
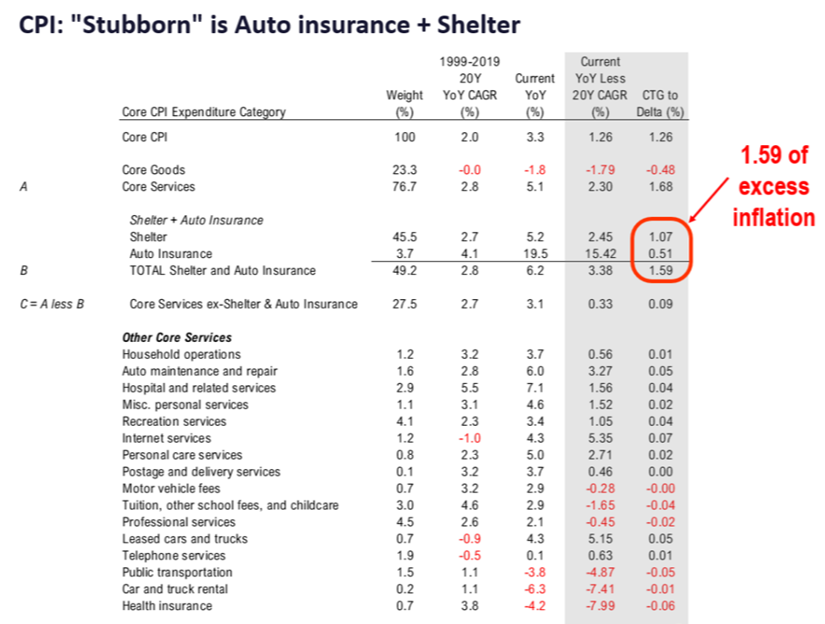
Removing those items, core CPI rose just 0.7%, which is half of the long-term average:
Furthermore, let’s touch on last week’s “systematic financial risks” from doomsayers, who said the fiscal effect from the unwinding of the yen carry trade would take liquidity down for months. At this point that doesn’t seem to be happening. Credit spreads aren’t widening, and the general sense of panic is ebbing, as shown by the VIX’s normalization and the margin debt stabilization.
In short, data is ahead of the news narrative once again.
Looking ahead, the next major economic event to watch is the Federal Reserve’s meeting in Jackson Hole on August 22-24. We think Fed Chair Jerome Powell will continue tilting doveish because of the benign July CPI report.
Still, let’s remember that August through October is often a tough period for markets. One client even joked to me recently that they have never made money in August. Kidding aside, that does agree with research from Fundstrat’s Mark Newton, which shows that August is the most common month for equities to bottom since 1928:
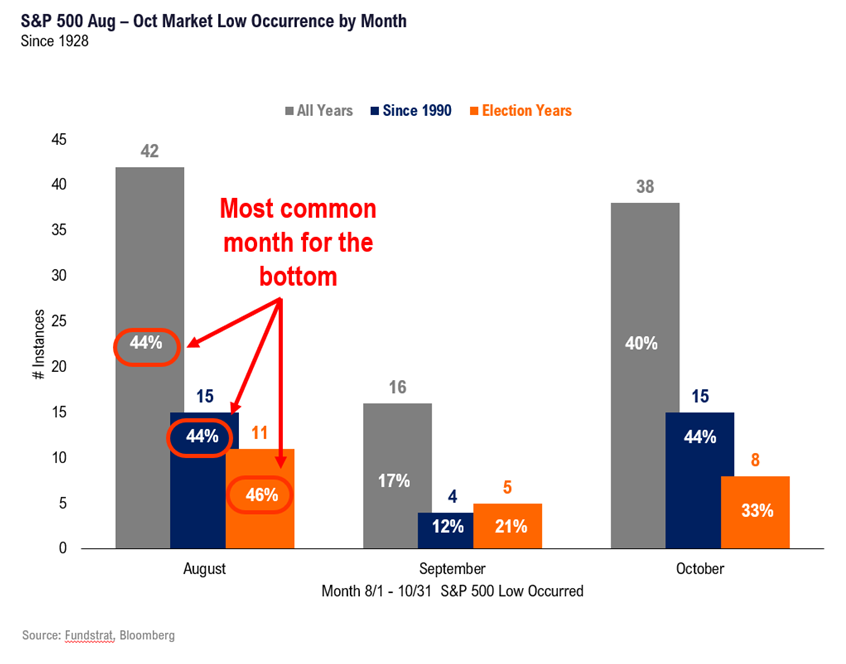
And if the bottom isn’t in August, it’s often in October, which is when it happened last year. As the chart above shows, 84% of market bottoms since 1928 occur in those two months.
Lastly, we still need to be mindful of Iran’s attack potential, especially considering recent high-profile aggressions and the Olympics ending (Iran is historically very calculated from a timing perspective). We’re naturally wary of this risk and its impact on equities, but it’s just not something we can model ahead of time.
Nevertheless, investors need to acknowledge the high-velocity impact more wars could have on markets. As more clarity becomes available, we can provide better guidance. That said, we also know the adage, “Sell the build-up and buy the invasion.”
The obvious implication is that equities would switch back to “risk off.” For us, the easy way to gauge this is to watch the VIX. Two Fridays ago, it closed at 24. As of this writing, it’s under 20. That’s a massive reversion from the early August high of 67. That decline is almost unbelievable.
The VIX is a telltale sign in the near term, and there’s some historical positivity worth pointing out. Going back to 1990, when the VIX hit 38.5 or higher (which only happened 239 times), markets soared afterwards:
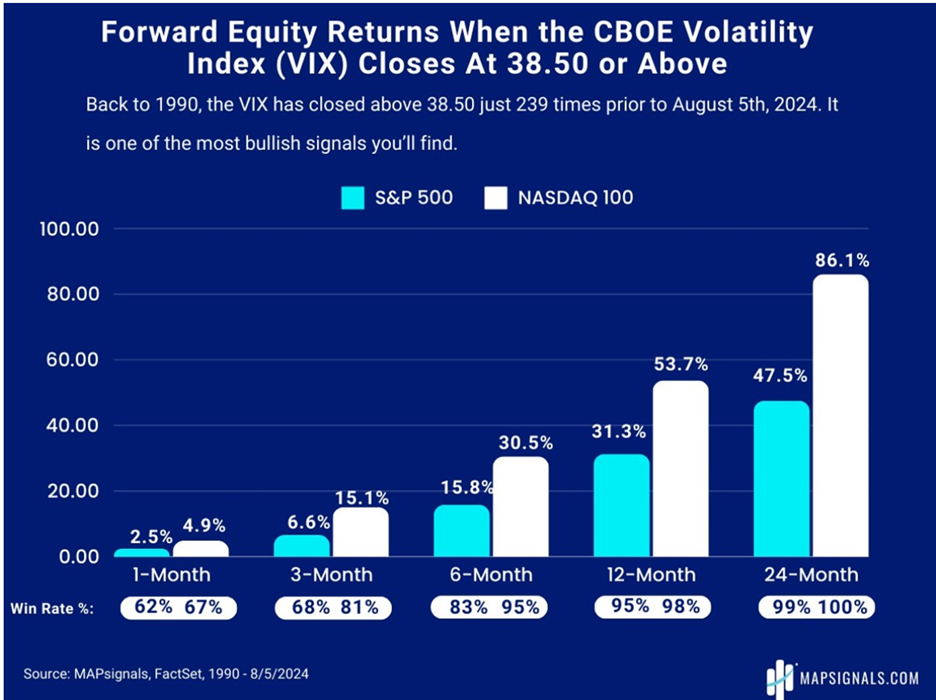
The silver lining is that extreme situations can produce extreme results due to the capitulation they create in the markets.
Capitulation
Most investors probably don’t realize that even though markets went a little haywire recently, looking at the last five trading days as of this writing (since Aug. 8), the S&P 500 is up almost 3%.
How did it happen? Capitulation.
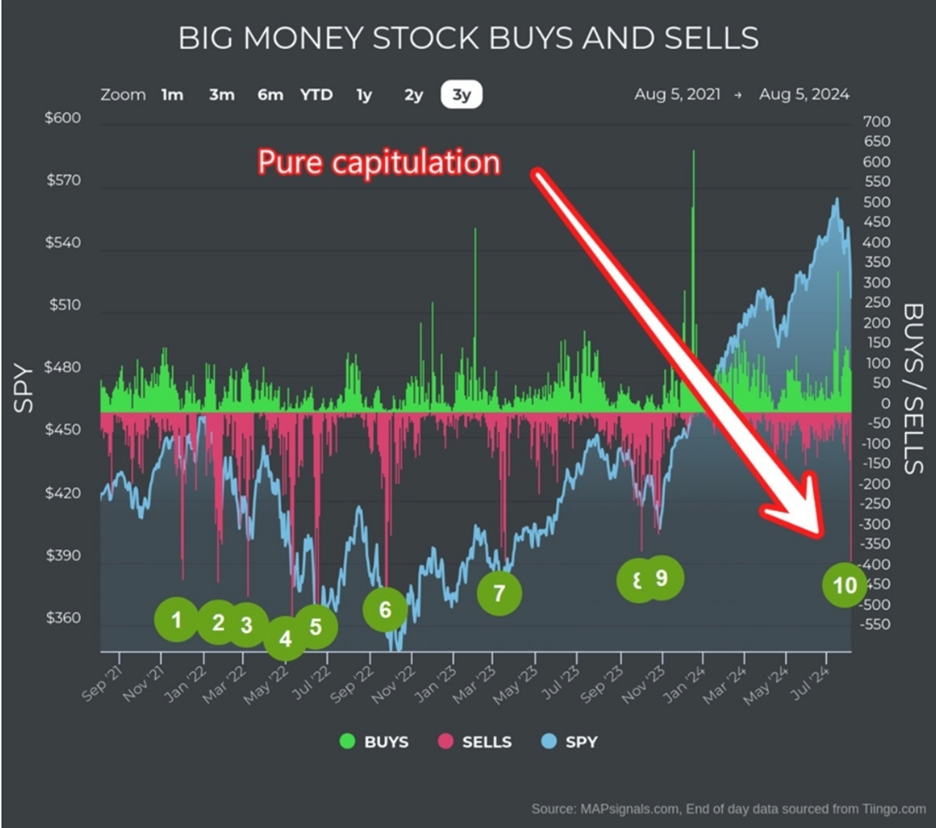
As the chart above shows, over the last three years there have been 10 instances of capitulation (10 is now).
Again, August through October is the most volatile period for stocks, and that pattern hasn’t deviated in 2024. Daily performance from Aug. 1-9 has been a wild ride:
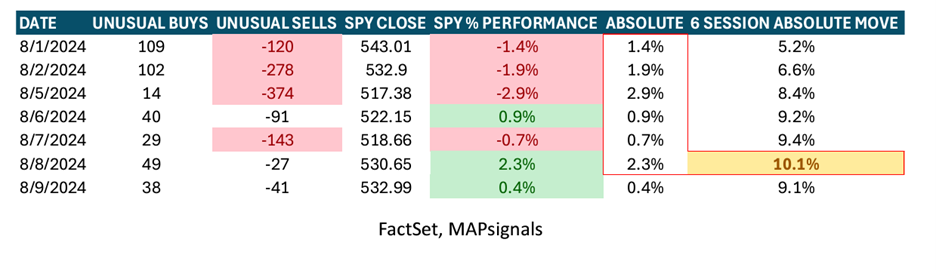
In an absolute sense, this is a rare patch of volatility. In just six trading sessions, the 10.1% absolute move represents a nearly $4.6 trillion shift in the S&P 500, which has a total market cap of $44.6 trillion. According to the International Monetary Fund's World Economic Outlook, that swing is roughly equivalent to Germany’s entire economic output.
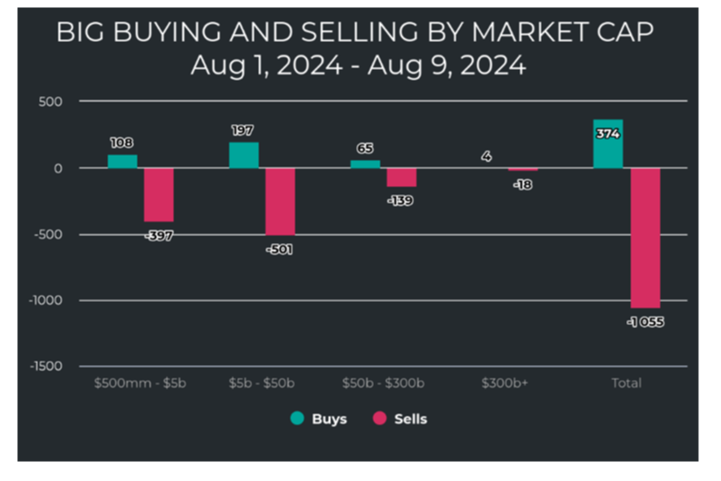
Digging deeper, unusual selling hit a fever pitch in a short time, rocking small- and mid-cap stocks, which were the darlings of July:
Looking at how similar selling episodes in the last three years compare, the orange line in the chart below shows the last time selling was this extreme (November 2022):
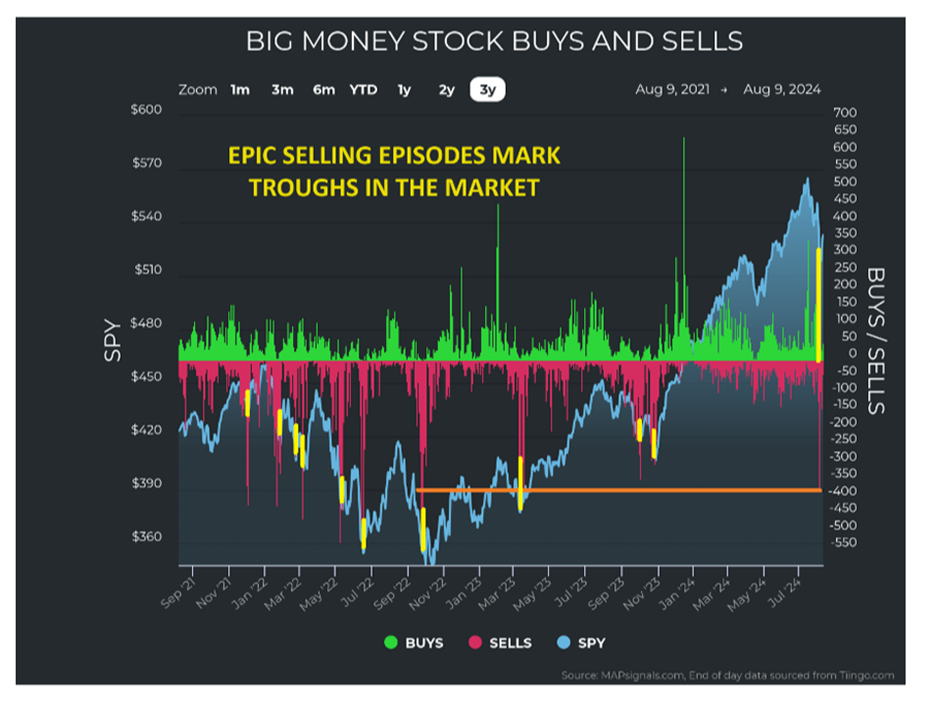
The yellow lines represent the immediate bottoms (i.e., capitulation). Also notice the significant bounces that follow afterwards. That doesn’t mean we’re now all clear, especially in an election year, but evidence suggests the worst of it is over for now.
Also, there have been 439 prior instances of 10% or greater absolute moves within six trading days (about 5% of the time). In other words, 95% of the time this doesn’t happen.
Perspective is key.
However, since 1990, such moves have occurred almost every year. So, these rare occurrences are also frequent. That may sound counterintuitive, but again, perspective is key.
And yet, forward returns after these volatile times are quite bullish:
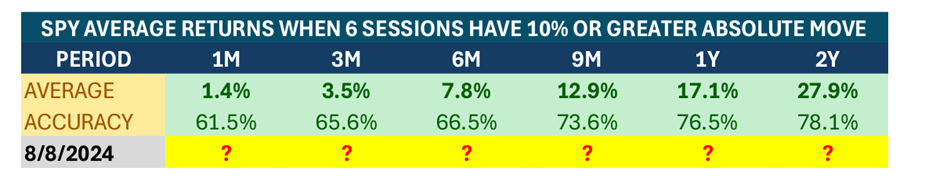
So, keep in mind that while we are experiencing a rare overall occurrence, it is a consistently rare occurrence, especially in August. When liquidity thins out, price movements become exaggerated. This is due to uncertainty being part of an options premium calculation when stocks tank (premiums naturally inflate).
Algorithmic traders short the index, pushing the price down, and spiking volatility. They then short the option with the inflated premium. Next, they buy back the index, which then makes the options premium fall. All that’s left is to cover the option short position to make money on both ends.
These algos all copy each other, which intensifies the phenomena. Add in lower liquidity along with uncertainty (e.g., Iran, Russia, Ukraine, Japan currency, election season, etc.), and you get the powder keg of early August. These high frequency trading firms make all their money for the entire year during these short few weeks.
But let’s focus on the long term. When these situations arise, remember Marcus Aurelius. He said, “You have power over your mind, not outside events. Realize this and you will find strength.”
* Links to third-party websites are being provided for informational purposes only. CoreCap is not affiliated with and does not endorse, authorize, or sponsor any of the listed websites or their respective sponsors. CoreCap is not responsible for the content of any third-party website or the collection or use of information regarding any websites users and/or members.
* The S&P 500 is an unmanaged index of 500 widely held stocks that is generally considered representative of the U.S. stock market.
Securities sold through CoreCap Investments, LLC. Advisory services offered by CoreCap Advisors, LLC. Cornerstone Financial and CoreCap are separate and unaffiliated entities.