

Let’s talk about the Federal Reserve’s recent rate decision. While the S&P 500* essentially closed flat that day, some of Fed Chair Jerome Powell's comments initially created market confusion, even though the 25-basis-point cut was universally accepted.
While equities initially responded negatively, in reviewing the press conference carefully, we at Cornerstone view Powell’s comments as doveish. It appears that’s the conclusion the market came to as well considering equities’ eventual climb back to even that day.
Some of the key takeaways from our analysis include:
1. For the first time Chair Powell said the Fed now views any tariff related price increases as one-time and not inflation:
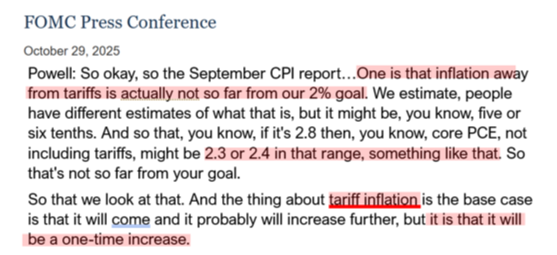
2. As seen above, the Fed now views implied inflation to be around 2.3% or 2.4%. That is almost in line with their “2% target.”
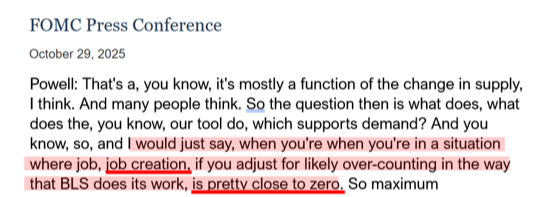
3. Chair Powell stated that while labor markets have slowing job gains, he chalks this up to supply. Therefore, the Fed thinks job growth is currently close to 0, which supports future cuts:
4. Powell clearly stated that while rates are now looser, he “wouldn't say that they are accommodative now.” That’s a telegraph there’s room for further cuts.
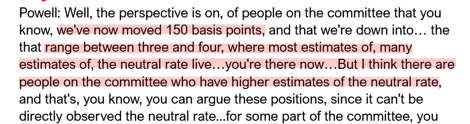
To summarize, this is overall positive commentary and continues the trend of the Fed becoming increasingly more doveish. In retrospect, it's clear that what caused the initial negative market response was the confusion created when the Fed stated that a December cut isn’t a foregone conclusion. That’s due to apparent disagreement among the FOMC members about the neutral rate.
Apparently, some believe the Fed is already there. But when considering the rest of Powell’s comments, we believe this is more noise than anything else:
If the job market continues to stall, the Fed will keep being doveish and cut rates further. Some may wonder if a slowing job market is reason for concern at the corporate level.
Well, as we continue through earnings season, there are no signs of that being the case. Just look at the blended net profit margin for the S&P 500 for the third quarter, which currently sits at 12.8%:
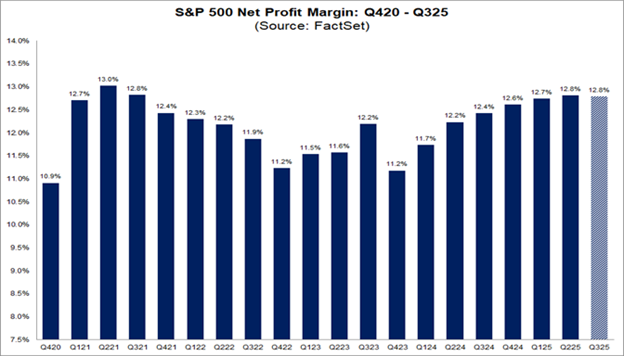
This is equal to the previous quarter, but above the previous year’s net profit margin and the five-year average. This means we’re trending towards the sixth consecutive quarter where the S&P 500 reports a net profit margin above the five-year average of 12.1%.
From a sector level, currently seven sectors are reporting net profit margins above their five-year averages, led by utilities, which is up 16.7% versus its five-year average of 13.6%:
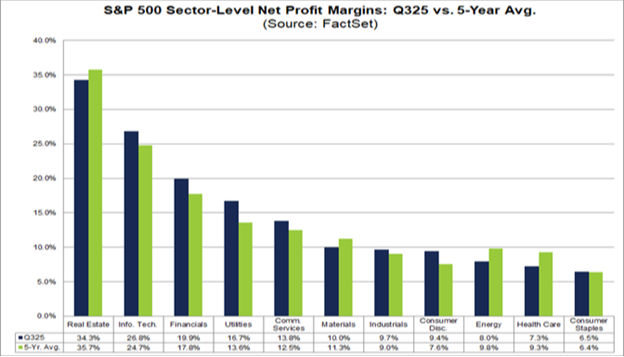
Lastly, we believe it's interesting to note how analysts believe profit margins will be even higher in 2026. As of today, estimated net profit margins for 2025’s last quarter through the second quarter of next year are 12.8%, 13.4%, and 13.7%, respectively.
This is fundamental support for continued corporate strength. And the underlying profit power is becoming especially noticeable within the highest quality stocks.
All About Quality
For most of this year, high quality stocks have been somewhat left behind in equity markets as more speculative growth names have outperformed. But it’s beginning to become clear that high quality is now offering a big opportunity.
Despite strong fundamentals, high quality “best in breed” stocks like Coca-Cola, Eli Lilly, Costco, and more have lagged momentum names. From the macro level, this is reflected in the fact that the S&P 500 Quality Index# has trailed the S&P 500 by 9% over the last six months.
At CFS, we define high quality stocks as those with fundamental attributes including but not limited to high returns on equity, stable year-over-year earnings growth, low leverage (debt), a history of growing dividends, and more. With characteristics like that, it's no surprise that these types of companies don't lag the overall market for long, historically:
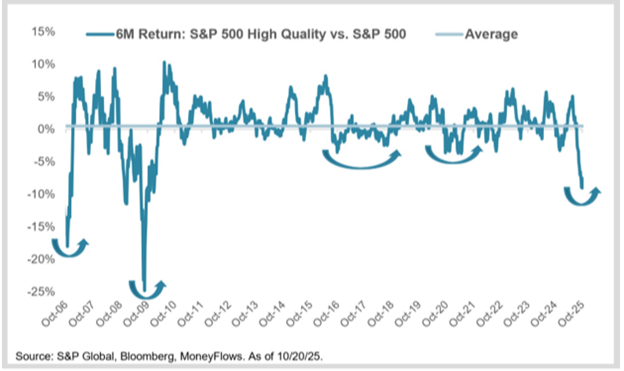
When these stocks have lagged, it’s provided a “buy the dip” opportunity time after time.
As we see here today, it appears we’re at the beginning stages of another opportunity to become more overweight on quality because it's on sale. Many times in the past, tactically increasing weight by buying quality on weakness has provided opportunities to add additional alpha to the overall portfolio:
As we've discussed in the past, bull markets rotate throughout cycles with numerous leadership changes. We're beginning to see that leadership handoff take place now.
Recent action under the surface shows quality names within the health care, energy, staples, real estate, and utilities sectors beginning to perk up. This is happening as this year's cyclical leaders like technology, financials, and industrials consolidate their massive gains.
This is healthy for the market overall because the quality trade is much more diversified in nature. For example, as you can see below, all but one name in the top 10 of the S&P 500 weighting is a tech company. By contrast, the top 10 list of the high quality index has just two tech names:
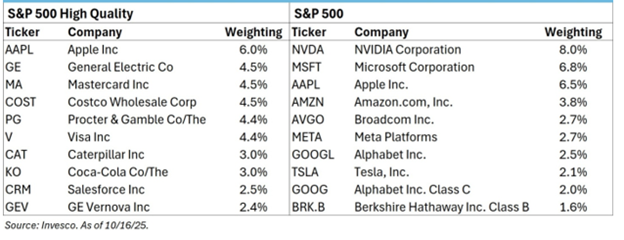
Digging just a touch deeper, comparatively the S&P 500 High Quality Index has just 23% of tech companies in the group versus 30% for the S&P 500:
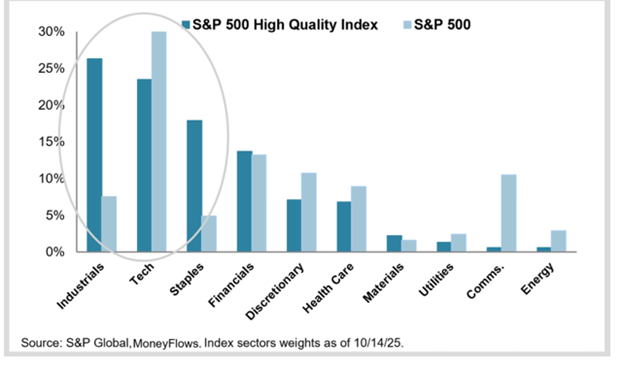
This leads to the quality trade offering more diversification. It’s also where you find stable companies with strong cash flows that typically reward shareholders with growing dividends.
While some may not have noticed this rotation yet, when we look at the data it’s becoming clear to us it’s taking place as the sector ranks have utilities, industrials, and health care as three of the top four overall:
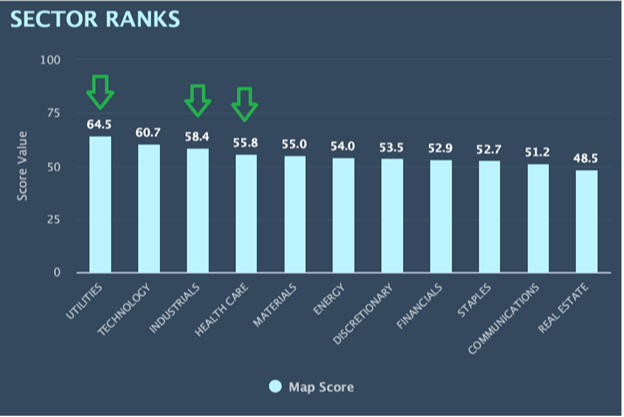
Maybe most surprisingly is the fact that for the first time since early in 2025, technology isn’t in the number one spot. This more diverse strength is a result of money flows underneath the surface.
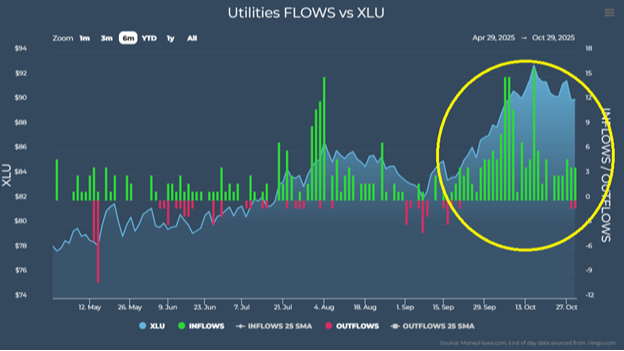
For instance, utilities is attracting significant inflows with no outflows:
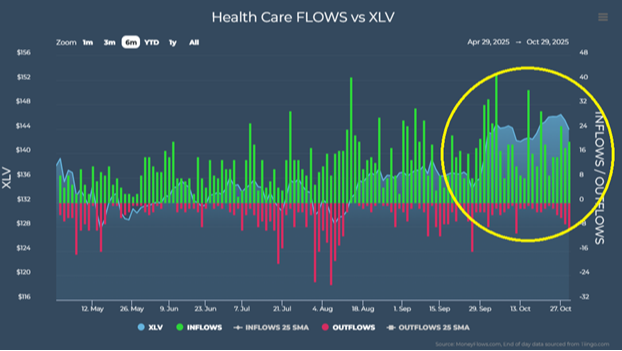
The same is true with the unloved health care sector. Pressured for over the last year and a half, we've seen a significant uptick in inflows recently:
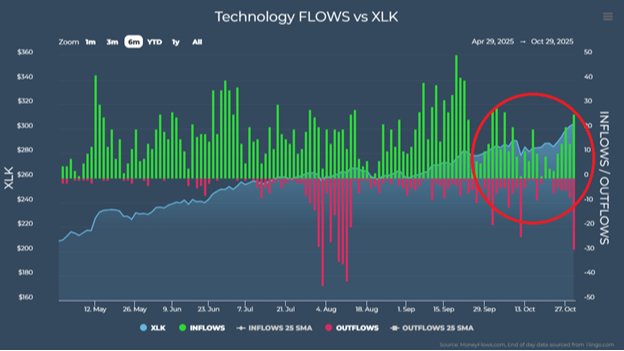
At the same time, there’s been a decrease within the technology sector. Many technology stocks continue to digest and consolidate their massive gains this year:
This leadership rotation going into the end of the year should be the beginning of a clear reflection on the importance of fundamentals. Just remember the net profit margin and earnings strength of companies within these sectors.
* Links to third-party websites are being provided for informational purposes only. CoreCap is not affiliated with and does not endorse, authorize, or sponsor any of the listed websites or their respective sponsors. CoreCap is not responsible for the content of any third-party website or the collection or use of information regarding any websites users and/or members.
*Past performance does not guarantee future results.
*Investing involves risk and you may incur a profit or loss regardless of strategy selected.
* The S&P 500 is an unmanaged index of 500 widely held stocks that is generally considered representative of the U.S. stock market.
# The S&P 500 Quality Index tracks the 100 highest quality stocks in the S&P 500 as measured by their S&P quality ranking.
Securities sold through CoreCap Investments, LLC. Advisory services offered by CoreCap Advisors, LLC. Cornerstone Financial and CoreCap are separate and unaffiliated entities.