


The past week or so has been the typical heart of the quarterly earnings season. It’s when we hear from the largest number of companies that also are the most important drivers of our economic growth.
This time during earnings season provides us with the greatest insight into the market’s overall underlying fundamental strength or weakness. Through the past week, 88% of S&P 500 companies reported earnings – 87% of them beat expectations:
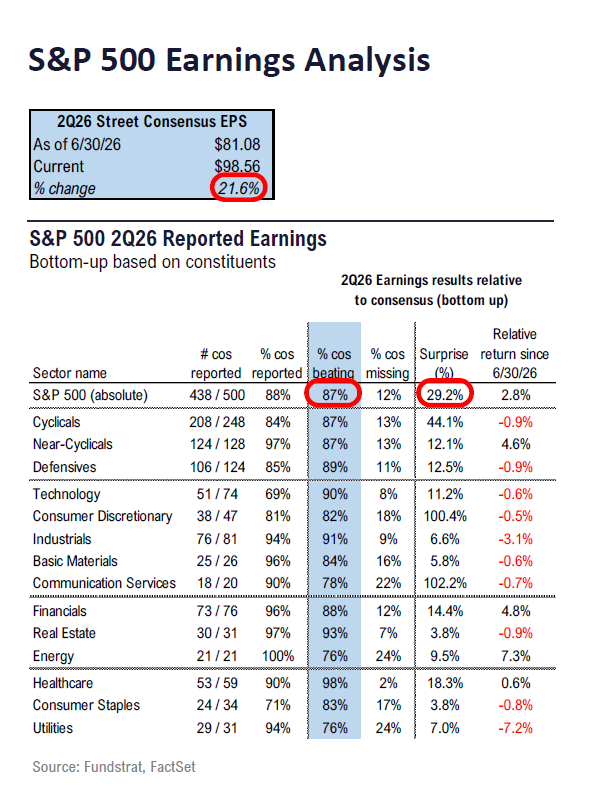
The beat rate alone is extraordinary considering the 10-year average is 76%.
Even more astounding, recent earnings are at such extraordinary levels that the actual year-over-year earnings growth rate is now 50.5%:
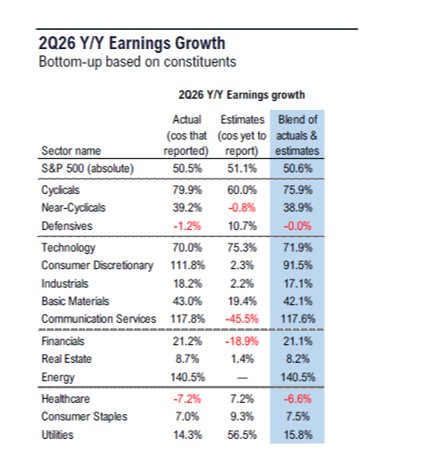
When including the estimates for companies yet to report, the blended year-over-year earnings growth rate is now 50.6%.
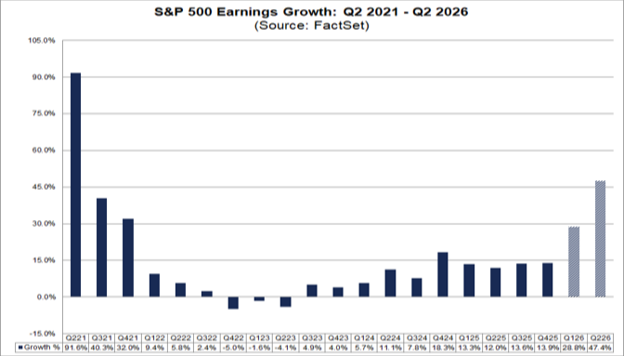
If that ends up being the actual growth rate for the quarter, it will mark the highest year-over-year earnings growth ever reported by the index outside of Q2 2021. That quarter was a COVID outlier since the economy was shut down a year prior, creating an “artificial” year-over-year growth comparison:
Furthermore, the current fundamental strength is reflected in hard sales figures. In other words, these earnings aren’t corporate finance hijinks. The blended year-over-year revenue growth rate now sits at 14.3%:
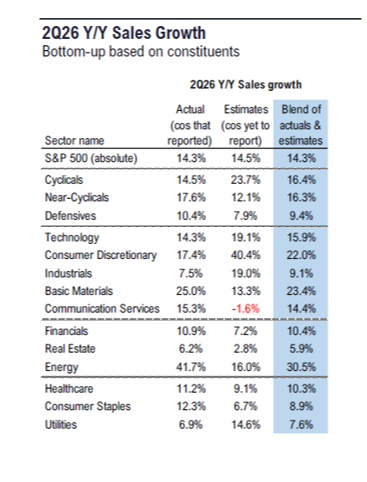
What’s more, 77% of companies have beaten revenue estimates, which is significantly higher than the 10-year average of 70%.
Earnings are working. Yet, the market’s been mired in choppiness.
During the back half of July, we set out to understand why market prices were so disconnected from historically strong fundamentals. The answer has become clear over the past few weeks.
We recently theorized about a potential cause of the volatility disconnect in June: the record $1.5 trillion margin debt deployed at the time. Following the March low to early June peaks, the S&P 500 and Nasdaq composite gained over 15% and 30%, respectively.
We all wondered who was selling if the business fundamentals hadn't changed. These companies didn’t suddenly become bad businesses.
It turns out, their shares had the wrong owner at the wrong time.
One hedge fund – Situational Awareness – was the seller. To summarize, the fund was heavily long AI infrastructure stocks and short software names. In July, both sides of that trade quickly went wrong simultaneously (AI names fell while software recovered).
Then margin calls forced a total liquidation of Situational Awareness’ entire public equity portfolio. It sold to a single individual able to provide the liquidity to stabilize the market, allowing Situational Awareness to meet its margin calls.
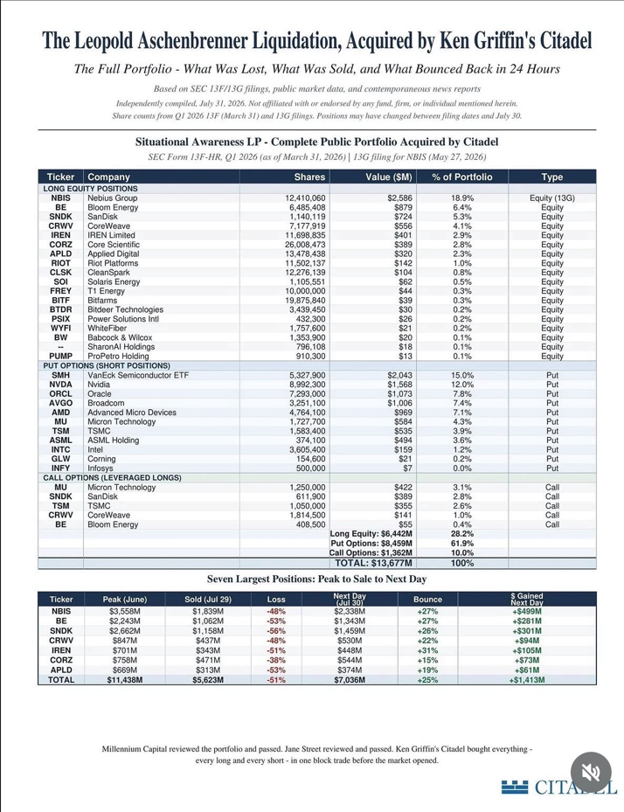
We’ve seen this single-fund-failure story before. A similar forced liquidation due to overleveraged margin took place in 2021 with Archegos Capital Management. That event wiped out over $100 billion in market value in a couple days.
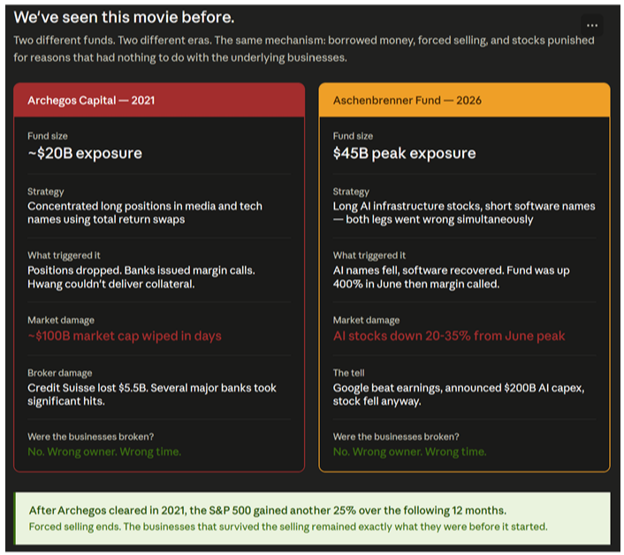
This time around, the overall exposure was more than two times greater.
Now, when you're managing $45 billion, you're not selling a handful of $5,000 positions. Instead, you're liquidating hundreds of millions of dollars per stock and every sale triggers more selling, creating a cascading effect. Then high-frequency algorithmic traders step in, widening bid-ask spreads, and causing any potential buyers to step back.
This type of cascading event doesn't stop or care to check whether the underlying businesses are fundamentally strong. The only thing that matters is getting cash before the closing bell.
Over the past couple weeks, there was a perfect example of the market behaving in two completely different ways after blowout earnings reports. It shows the power of forced selling.
On July 22, during the peak of forced selling, Google parent company Alphabet reported earnings that flew past expectations, showing a net profit gain of $98 billion and per-share earnings of $9.11:
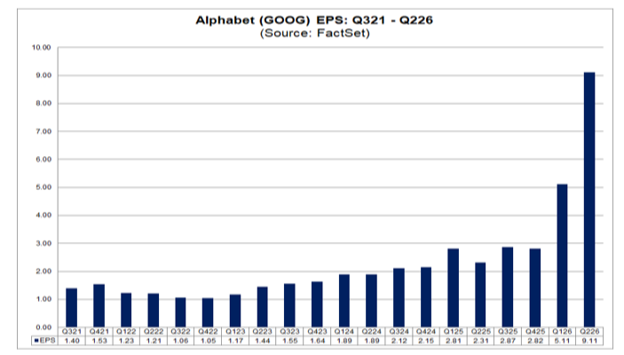
But the market didn’t judge the business itself as shares fell significantly. Clearly, someone needed liquidity and Alphabet was an easy way out.
Comparatively, after forced selling was flushed out of the system on July 30, Amazon reported equally astounding earnings that also flew past expectations. Its profit was $53.4 billion, with EPS of $5.75:
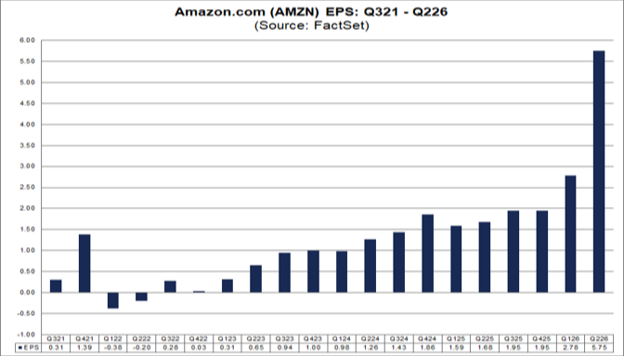
The market rewarded Amazon immediately, with its stock price increasing by over 10% the following day alone.
The difference between these two situations can be traced to Situational Awareness. Once its leverage was gone, selling dried up. The forced seller exhausted itself, also causing the short sellers that had been taking advantage of this situation to scramble to cover.
Immediately, stocks under pressure for weeks surged double digits in a single session, turning from outflows to inflows. The forced selling immediately dried up in the following days:
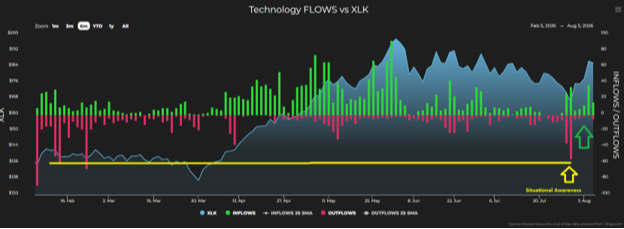
To illustrate the magnitude of this forced selling by one over-leveraged hedge fund, we can trace the yellow line above back to Q1 of this year when the market experienced extreme volatility in the face of the unexpected Iran War. Put another way, one fund’s forced liquidation generated selling that’s similar to a massive geopolitical event.
The outsized selling in technology stocks over a three-day period triggered 96 discrete outflow indicators:
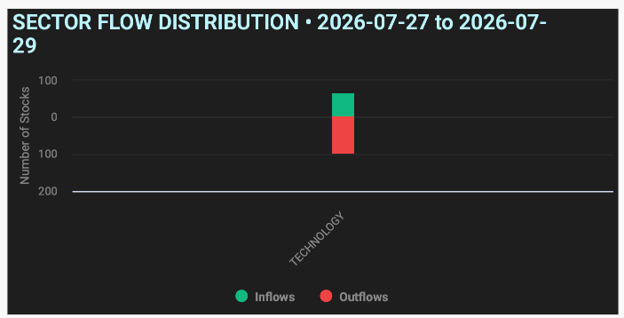
That was the highest amount since early February, when we saw 106 discrete outflows at the start of the Iran conflict.
Now that we understand the cause, the question is what do we expect looking forward? Since 2014, there have been 66 similar instances. Historically, those moments were clearly not for continued selling, but for recovery.
In similar scenarios, the State Street Technology Sector exchange-traded fund (XLK) has gained 3.5% the following month, 11.9% over three months, 17.8% over six months, 27.8% over 12 months, and 64.2% over the following 24 months, respectively:
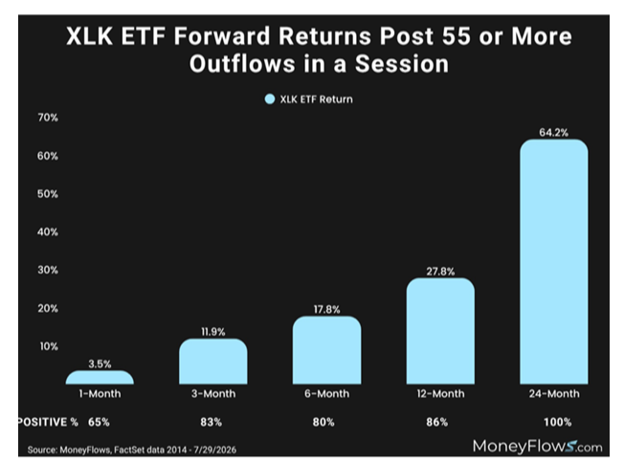
Most importantly, the 24-month win rate is 100%. Thus, history tells us that extreme outflow events specifically concentrated within the technology sector are an opportunity, not the beginning of something worse.
As companies continue to report record earnings, remember how the stocks attached to those companies haven't broken – the leverage did. This is a midterm election year, and even though this over-leveraged risk has been unwound, history tells us that August and September remain a caution zone.
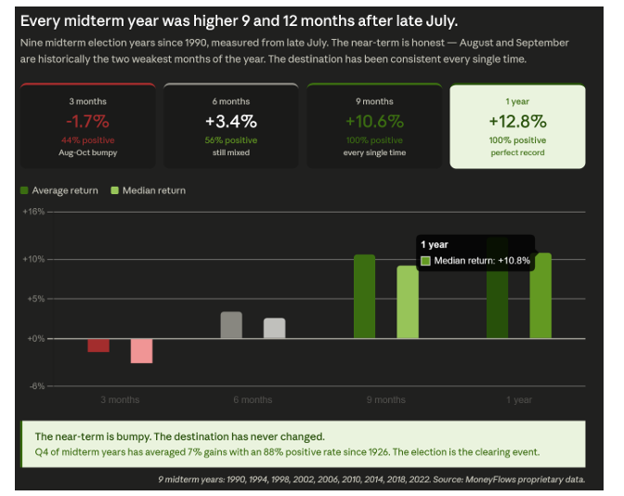
But we also know elections bring clarity. It will be the next clearing event, providing historical precedent strength over the six-, nine-, and 12-month periods following the election cycle.
Yes, we’re in the middle of the expected turbulence. But the long-term destination hasn't changed.
*Links to third-party websites are being provided for informational purposes only. CoreCap is not affiliated with and does not endorse, authorize, or sponsor any of the listed websites or their respective sponsors. CoreCap is not responsible for the content of any third-party website or the collection or use of information regarding any websites users and/or members.
*Past performance does not guarantee future results.
*Investing involves risk and you may incur a profit or loss regardless of strategy selected.
Securities sold through CoreCap Investments, LLC. Advisory services offered by CoreCap Advisors, LLC. Cornerstone Financial and CoreCap are separate and unaffiliated entities.