


We’re still in the heart of the all-important earnings season, which has continued to be extraordinarily strong once again. Many would not know this if they’re only paying attention to the recent volatile market action.
Sitting here today, the reasons for this disconnect are clearer by the day as we become aware of other data and factors that are significant contributors to the July’s downward market pressure and volatility, especially over the last week or two. Interestingly, last week we at Cornerstone became aware of a significant event specifically related to the margin leverage risk that we discussed and analyzed only a week ago.
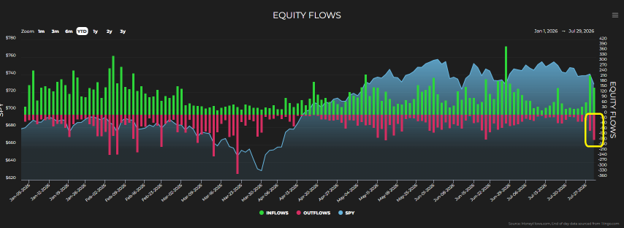
Last Thursday morning, it was reported that “wonderkid” Leopold Ashenbrenner's high flying hedge fund was forced to sell its entire portfolio of public stocks due to massive margin calls by his firm's prime brokers. His hedge fund, Situational Awareness, was reportedly forced to sell nearly $24 billion in net assets.
This included unwinding highly volatile stocks like SanDisk, Micron, CoreWeave, SK Hynix, and others. The level of forced selling over a short period begins to help explain some of the market repricing and fundamental earnings.
We can see the significant two-day increase in institutional equity sells, which can almost assuredly be attributed (perhaps entirely) to just this one hedge fund’s forced selling:
Maybe even more interesting, the day after the forced selling was completed, there was a massive V-shaped rebound across the same stocks Situational Awareness was forced to sell. Other funds could experience the same events in the short term but most importantly we have clear evidence attributable to the disconnect between the recent market price and fundamental strength we discussed a week ago.
Furthermore, we can now begin to have further confidence in the important fundamental foundation playing out this earnings season. It will likely contribute to longer-term performance expectations.
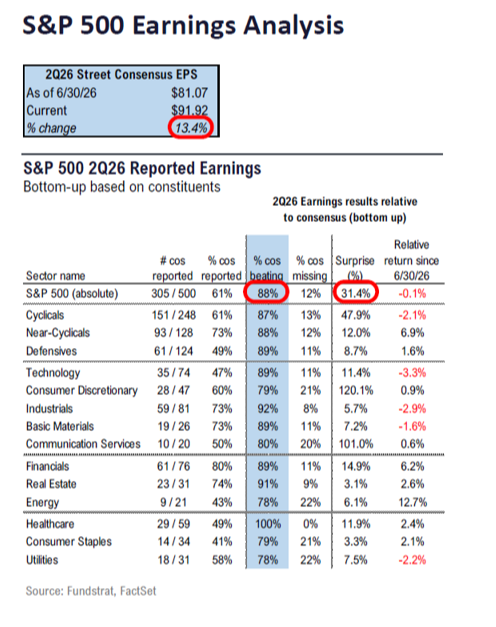
As of this writing, we've now seen 61% of S&P 500 companies report with 88% of those companies beating estimates with an astonishing surprise to the upside of 31.4%:
Even more impressive is how the companies that have reported so far are showing actual year-over-year earnings growth of 57.6%:
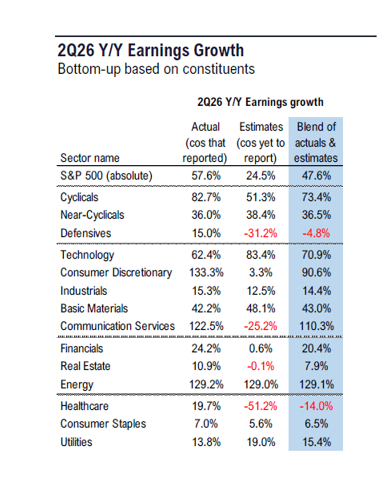
The blend of actuals and estimates for year-over-year earnings growth now sits at 47.6%.
These astonishing results thus far aren’t isolated to earnings growth. Most importantly, they’re trickling down to critical net profit margin figures.
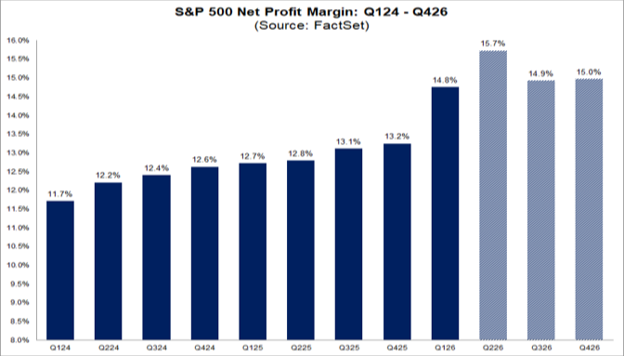
For example, the S&P 500’s blended net profit margin for Q2 2026 now sits at 15.7%:
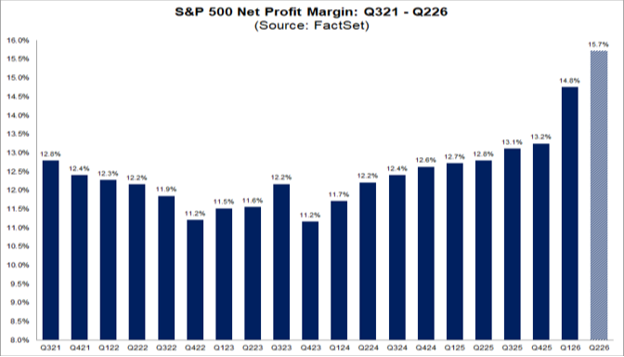
If 15.7% is the actual net profit margin for the quarter, it will be the highest reported net profit margin since FactSet began tracking this metric in 2009. Also, it would easily break the current record of 14.8% from last quarter.
Additionally, even with the current volatility concerns, it’s interesting how analysts project net profit margins for Q3 and Q4 to be 14.9% and 15%, respectively:
Taken together, it’s reasonable to believe the recent selloff in “bottleneck” AI sectors are entering the late stages of this consolidation.
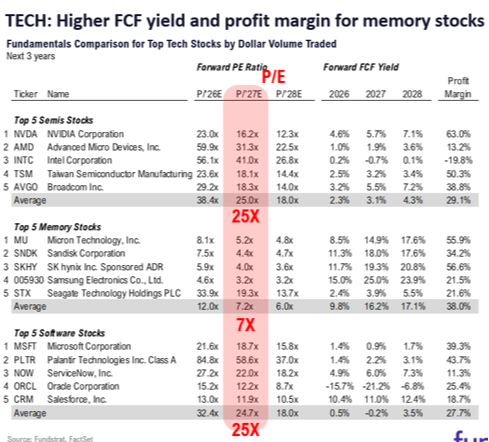
This is especially true within the memory stock group. The recent selloff pushed its members to their most attractive forward-looking risk/reward valuations since late last year:
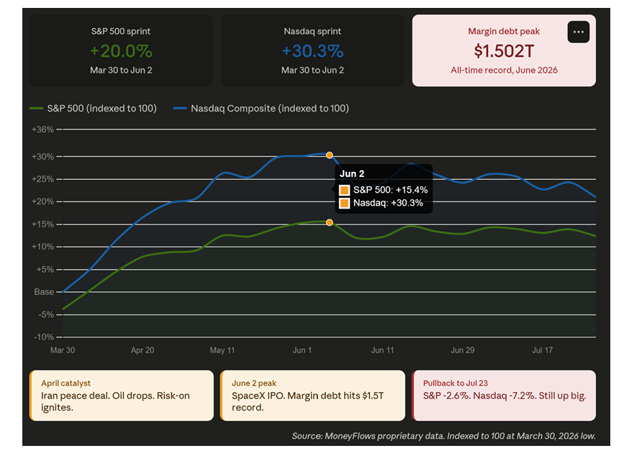
To us, understanding that price momentum works in both directions, we can begin to understand that the recent price resetting is normal in a healthy bull market, albeit exasperated by excess leveraged concentrated with one major hedge fund. For perspective, remember that from the March low to its June peak, the S&P 500 gained more than 15% while the Nasdaq Composite exploded over 30%.
At the same time, we saw leverage balloon to a record high. As an analogy, the recent market action is like when an engine pushes too hard and overheats. In the market’s case, the overheating is seen in sloppy day-to-day selling.
Importantly, throughout the recent market volatility, fundamental scores increased while technical momentum scores fell off the table. Those technical factors reflect the real price damage. Businesses didn't change, prices did.
As we see the momentum shift, can stocks continue to rally and extend this bull market over the months and years ahead? We think so. And from a historical standpoint, there are three strong macro indicators supporting this long-term outlook.
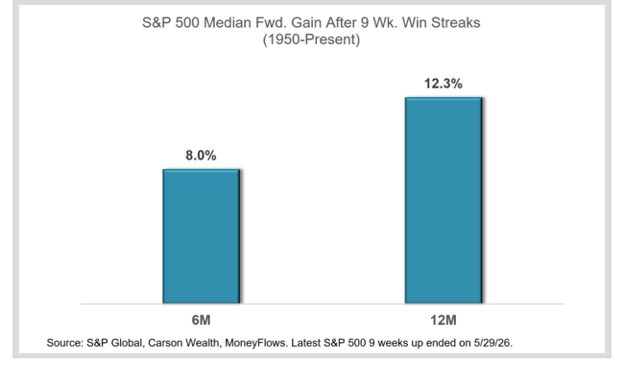
First, back in Q2 we experienced an extraordinarily rare event when the S&P 500 rose for nine straight weeks. It’s only the 11th time it happened since 1950.
History tells us that following such market strength, the S&P 500 notched median gains of 8% and 12.3% respectively, both of which are well above average:
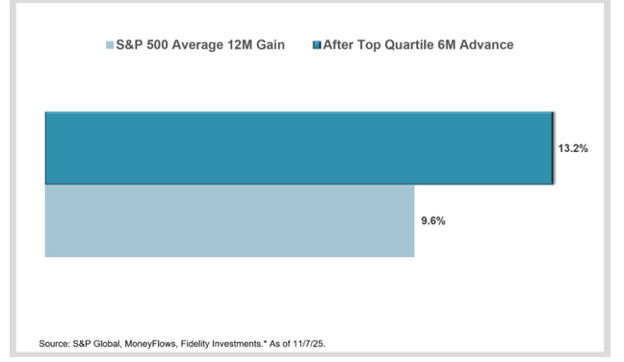
Second, the historical macro presence also tells us that top quartile S&P 500 rips (like in Q2) are also extremely rare. Following instances of that level of market strength since 1990, the S&P 500 averaged a 13.2% gain in similar years:
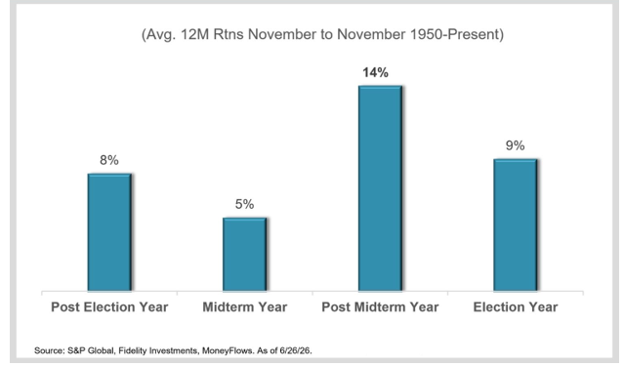
Lastly, as we have discussed all year, we’re ready for relative midterm weakness over the next couple of months. But as long-term investors, it's most important to focus on the historical pattern in the 12 months following midterm elections.
Since 1950, the S&P 500 has risen 95% of the time in those following 12 months. Better yet, post-election, the S&P 500 12-month gains have averaged 14%, which is about a 50% premium on the 9.5% long-term average annual return:
It’s been a choppy year. The unwinding of excess leveraged aligned with healthy profit taking in the top momentum names. But the objective data and math points to the same destination every time over the long-term that starts in Q4 of a midterm year.
Leverage will come out of the system. Seasonal headwinds will pass. The election will take place. Great businesses sold because somebody needed liquidity will still be as fundamentally strong as they were on June 2. That’s evidence once again of this quarter’s outstanding fundamental results.
*Links to third-party websites are being provided for informational purposes only. CoreCap is not affiliated with and does not endorse, authorize, or sponsor any of the listed websites or their respective sponsors. CoreCap is not responsible for the content of any third-party website or the collection or use of information regarding any websites users and/or members.
*Past performance does not guarantee future results.
*Investing involves risk and you may incur a profit or loss regardless of strategy selected.
Securities sold through CoreCap Investments, LLC. Advisory services offered by CoreCap Advisors, LLC. Cornerstone Financial and CoreCap are separate and unaffiliated entities.