

As we at Cornerstone continue to navigate the current market volatility, we believe last week's market action included a couple of notable inflection points. Today, we want to analyze them. We’ll consider the current underlying market data to help us understand what to expect in the short term so we can plan for the long term.
The first notable event came last Tuesday, March 17, with the dramatic drop in the CBOE Volatility Index (VIX), commonly known as the market’s fear gauge. It went down to 22 after it surged past 35 as recently as March 9.
Interestingly, this drop in volatility occurred even while visibility around the U.S.-Iran War and its duration has not improved. Drops in volatility are often associated with improved risk-reward outlook for stocks.
To illustrate, the VIX moving above 35 and then falling below 25 has occurred 36 times since 1990. Removing recessions, the following one-month, three-month, and six-month returns in those instances are 1.9%, 5.2%, and 9.3%, respectively:
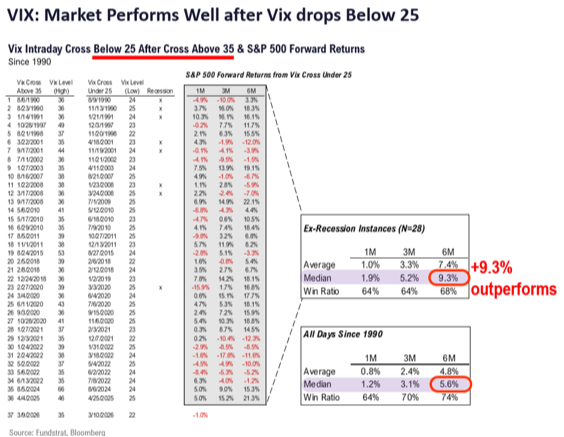
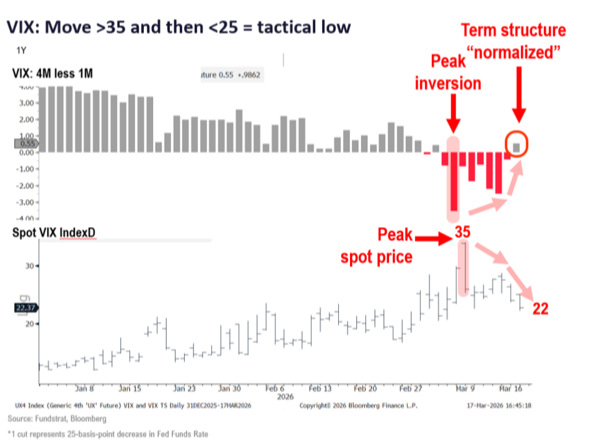
While nobody can ring the bell at the bottom, the VIX moving like this is historically the initial sign of an improved risk-reward market environment. That’s further supported in the VIX term structure, which has returned to a positive value after reaching peak inversion on March 8 and normalized on March 17:
The future is unclear and we remain uncertain about the path of the U.S.-Iran war. Still, the movement in the VIX is beginning to tell us it's possible that much of the bad news is priced in already. However, uncertainty currently remains high.
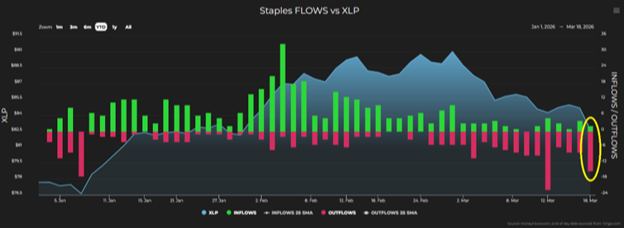
The second interesting market action took place last Wednesday, March 18. The S&P 500 fell 1.4% that day. That alone is not interesting. But what is interesting is that this downside movement was led by defensive sectors. Even more curious, we saw “risk off” gold falling 3.2% that same day.
The interesting aspect of this market action is that in times of uncertainty and volatility, when equities decline, investors would typically expect defensive stocks to outperform. But that wasn’t the case this time.
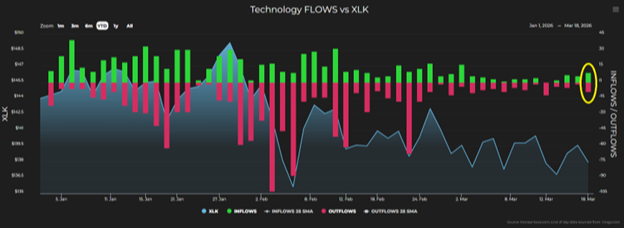
In contrast, we saw technology, financials, and MAG-7 outperform defensive areas like consumer staples, health care, and gold. This is reflected in the following two charts.
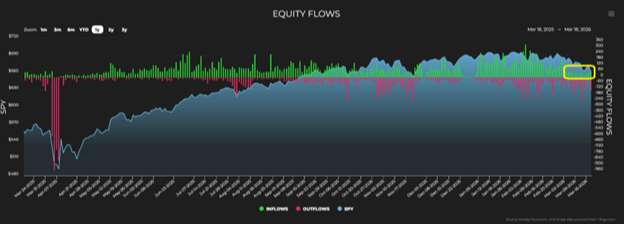
On the far right, there were significantly more outflows in the staples sector:
Than there were outflows in the more risk-on growth technology sector:
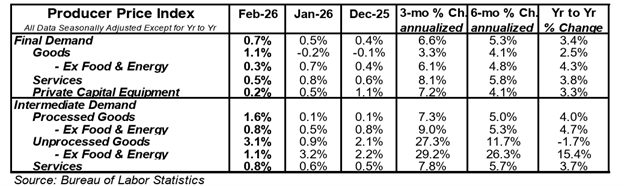
It was clear that there were several factors that likely contributed to the market weakness last Wednesday. They included a higher-than-expected February producer price index report (below), additional adverse developments in Iran causing oil to spike higher, and comments by Federal Reserve Chairman Jerome Powell highlighting overall uncertainty.
But we believe that none of that was a surprise to the markets. Consider that as we discussed last week, prediction markets had already reflected all this risk. If that is the case, it would begin to explain the strength in growth sectors instead of defensive sectors, as would normally be expected.
In our opinion, it means the market isn’t processing any new information and most or all of the bad news has been priced in at this point. The outperformance of technology and financials versus defensives highlights that, even with the current uncertainty, investors are not continuing to price in downside expectations to overall economic growth. If that was the case, gold and defensives would have been the outperformers last Wednesday.
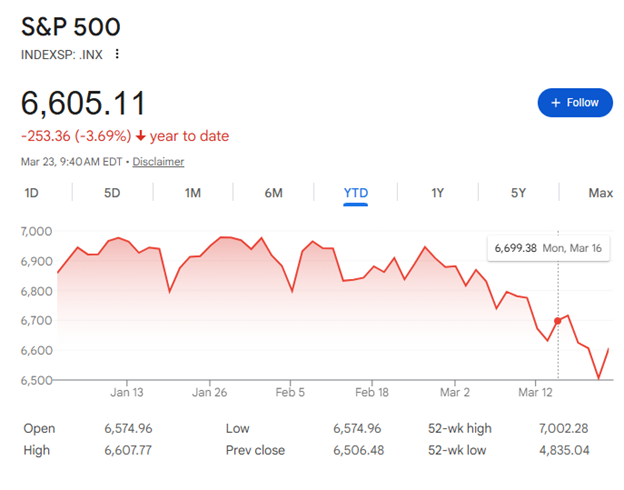
That said, it doesn't mean we’re completely out of the woods in the immediate near term. Even with all this uncertainty, it's somewhat surprising the S&P 500 is only down 3.69% year-to-date, although we are at lows for the year so far:
The market weakness is now being reflected in the trusty Big Money Index (BMI) from MoneyFlows, which is a 25-day moving average of institutional investor activity. The BMI has begun to drop quickly, now sitting at 49.7%, the lowest it has been since early December.
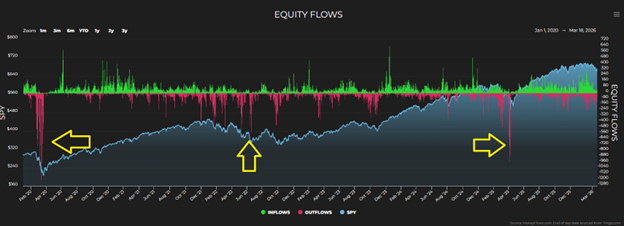
While technically not oversold yet, last week we broke key support levels for the S&P 500 (specifically, the 200-day moving average). From a macro perspective, this tells us that over the immediate near term, we should expect further volatility.
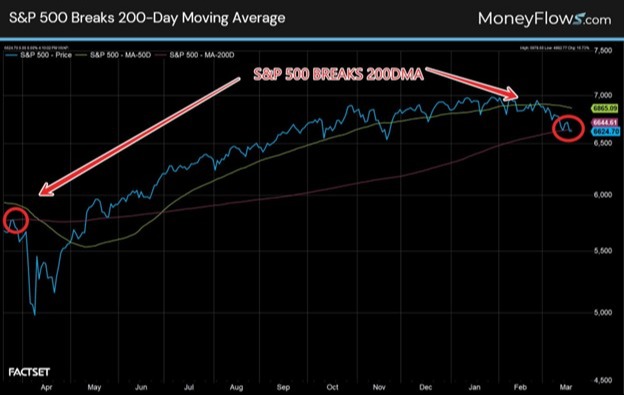
This is the first breach of this support level in roughly a year, when markets experienced their tariff tantrum in late March and early April. The 200-day breach coincides with the BMI’s quick decline:
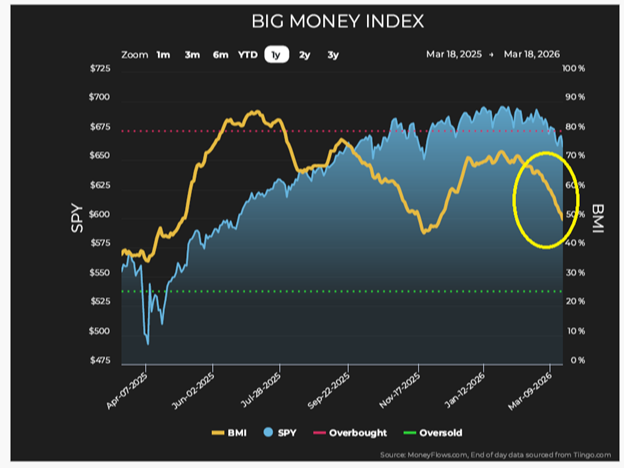
Importantly, this helps us understand the current overall trend of supply rising and demand falling. But it's important to point out that the biggest contributor to the BMI beginning to fall is buying almost completely drying up rather than a significant increase in overall selling.
To help visualize the difference taking place today in comparison to some recent periods of significant BMI pressure, you can see in the next chart with the yellow arrows looking at 2020 COVID, 2022 interest rate hikes, and the 2025 tariff tantrum. Massive selling jumps were significant contributors to those events.
Why point out the difference in comparison to today? The reason is the current data indicates that the BMI will continue to fall further over the next seven to 10 trading days.
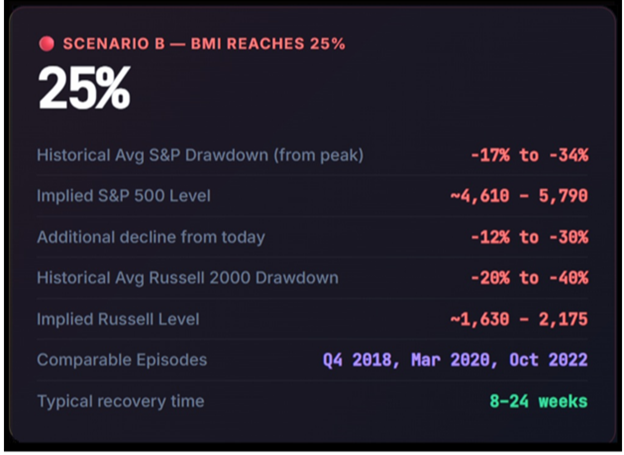
If so, then it is important for us to understand two key oversold BMI readings, which are 35% and 25%. A 35% BMI indicates initial oversold conditions whereas the 25% BMI shows extreme oversold conditions.
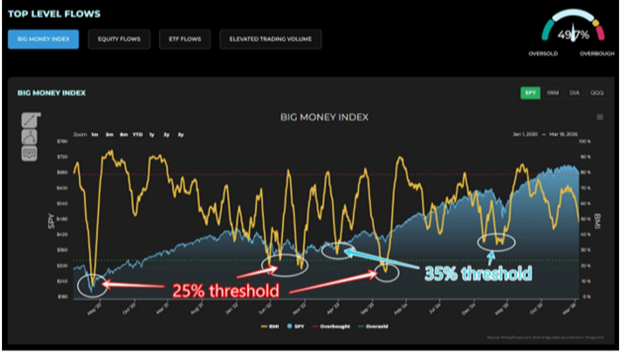
The recent extreme oversold events took place in 2020, 2022, and April 2025. It was a result of extreme selling, which is unlike what we are seeing in the current data today.
It is more likely the current volatility will lead to a 35% BMI environment. We can’t know for sure, but we can prepare for what’s to come.
But the past has shown how oversold conditions don't last long. So, here’s what we expect.
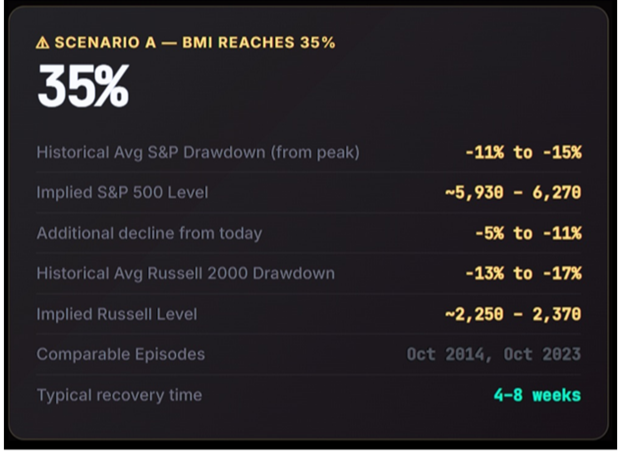
When the BMI falls to 35%, the S&P 500 typically reaches a correction zone around an 11%-15% drawdown. If that's the case, then we would plan for the S&P 500 to approach somewhere around the 6,200 level (about 6%-8% lower than where we are today).
In scenario two, if the BMI was to reach 25%, we would expect the S&P 500 likely break below the 6,000 level. But remember, for that to happen we'd have to experience extreme oversold conditions like we saw during COVID, huge interest rate hikes, and tariff tantrums.
In each scenario, quick and drastic V-shaped recoveries took place. This is why it is paramount that we pay close attention and study money flows. They’ll tell us the timing and plan looking forward.
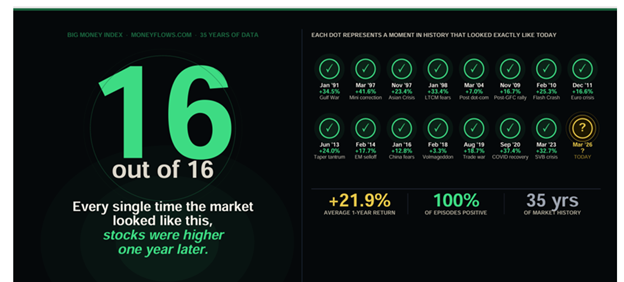
To understand what typically follows the specific market conditions we're experiencing today, going back to 1990 there were 15 comparable environments to today's market data. In those historical comparisons, one year later the S&P 500 was higher with an average one-year return of 21.9%.
As always, our historical and money flow data will lead us into the future, just as it’s led us in the past.
* Links to third-party websites are being provided for informational purposes only. CoreCap is not affiliated with and does not endorse, authorize, or sponsor any of the listed websites or their respective sponsors. CoreCap is not responsible for the content of any third-party website or the collection or use of information regarding any websites users and/or members.
*Past performance does not guarantee future results.
*Investing involves risk and you may incur a profit or loss regardless of strategy selected.
Securities sold through CoreCap Investments, LLC. Advisory services offered by CoreCap Advisors, LLC. Cornerstone Financial and CoreCap are separate and unaffiliated entities.