

When it’s all said and done, after what seemed like an overwhelmingly negative November, a quick reversal and runup of over 325 points on the S&P 500* in the last five trading days led to a positive month (0.2% gain). Suddenly, there was a gain.
Why was there a V-shaped bottom in late November?
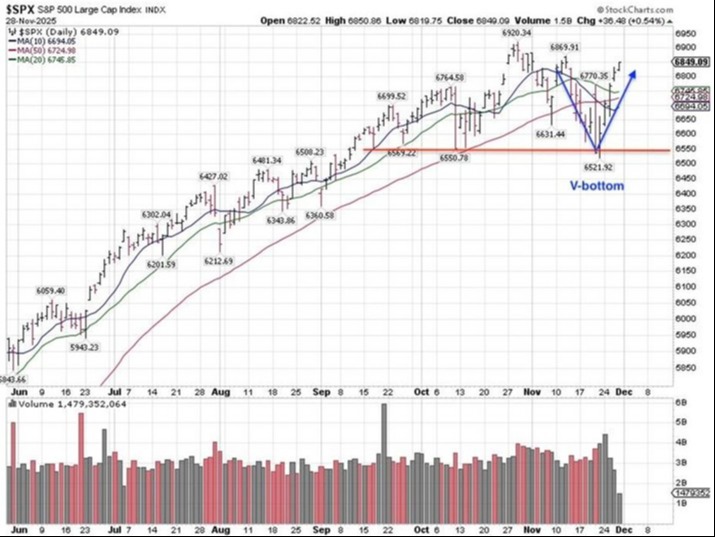
Now that we have all the trading data, we at Cornerstone can play Monday Morning Quarterback. The bottom from three Fridays ago came on an unusually large options expiration date, to the tune of $3.1 trillion in notional value.
In its simplest form, the bigger the notional value on the date options expire, the weirder trading becomes leading up to that time. While we can never be certain, we wouldn't negate the option dealers’ algorithms being a significant cause of the increased volatility and sharp declines in markets leading up to that expiration date.
The significance of the notional value on that date would provide a level of cursory evidence that the middle of November was more likely a false breakdown. That’s especially true when combined with the intermediate-term buy signal provided by the double-digit percentage decline in the CBOE Volatility Index (VIX)#.
It came seemingly out of nowhere around the same time:
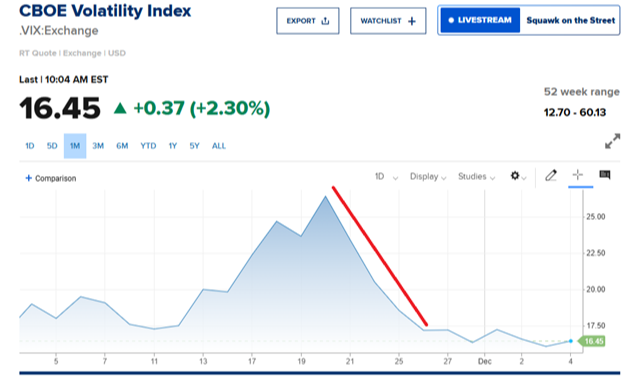
Double-digit percentage declines in the VIX like that mean large hedges taken against the S&P 500 were being liquidated. Instead of buying more put options, institutional investors began selling options. It produced a more bullish and less volatile environment.
Interestingly, this is similar volatility and options action to what we saw in October. While we don’t know the future (and nobody else does either), if the charts going forward are like early October action, it would support the V-bottom igniting the always anticipated Santa Claus Rally to end the year.
It would be normal for the market to quickly retract over the next few days, but nothing that would retest the November lows in any meaningful way. In fact, yearend bullishness should be further supported by the Federal Reserve actually cutting interest rates again this month.
Throughout the second half of this year, we've covered many positives for the market that we won’t revisit today (e.g., Fed easing, accelerated earnings growth, deregulation, etc.). Those and the market technicals discussed above are joined by a couple of newer positives emerging that increase the probability of keeping this bull market on track.
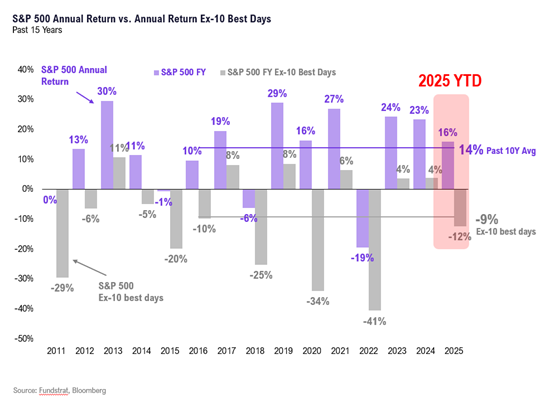
As readers know, we think pullbacks are normal and healthy because they reset investor expectations. But pullbacks too often heighten investors’ emotions and cause them to miss key resets and hugely positive trading days, which can kill overall annual returns.
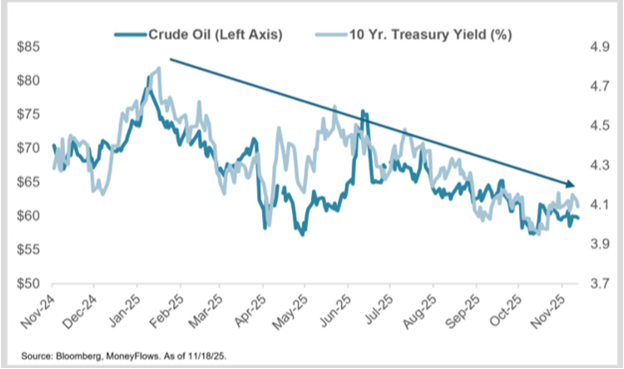
Two positives are now simultaneously converging: declining crude oil prices and finally long-term U.S. interest rates. Taken together, these declines help consumers and businesses. Historically, this combination is a significant tailwind for market returns.
Since January, long-term interest rates are now down 15% while crude oil has fallen 25% over the same time frame:
When both 10-year yields and oil prices fall 15% or more in the prior year, the S&P gains an average of 18.9% over the next year:
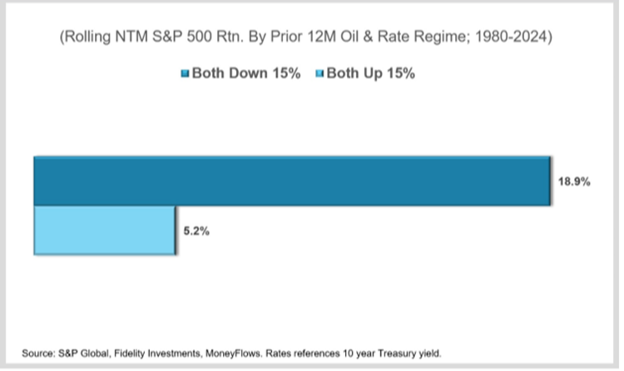
That's triple the return as when oil prices and rates rise simultaneously.
This dynamic improves financing costs for businesses, boosting capital investment. At the same time, lower oil prices ease pressure at the pump for consumers, putting more money in their pockets.
As we recently wrote, during the November volatility highs there was a massive quality rotation out of high-flying speculative stocks from earlier in the year. This countercyclical rotation played out exactly as historically expected. Yet again, quality is key when volatility rises.
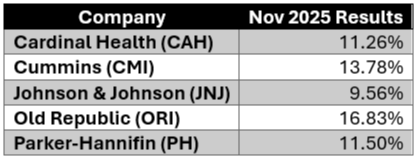
Closer to home, this was clearly reflected in the divergence of our two foundational equity strategies. In the face of November's volatility, our high-quality dividend growth strategy finished the month up 5.7%.
Peeling the onion back, this level of performance and volatility resistance was due to extraordinary results from quality dividend stocks^ like these ones:
It’s clear that even though quality defensive equities outperformed during volatile drawdowns, our job as investors is to look forward in anticipation of what’s to come.
Historically, we would expect and favor a bullish transition back to blue chip cyclicals following weakness like we experienced in November. This doesn't mean high quality defensive stock winners like those described above should be ignored because it’s crucial to be effectively diversified when volatility spikes.
But for those who can follow the data, these dips provide opportunity. Cyclicals are more economically sensitive and have benefited most when interest rates and oil prices fall simultaneously.
As you can see, when the combined percentage decline of long-term Treasury yields and crude oil prices are in the top decile, cyclical sectors have gone on to outperform the S&P 500 by significant margins over the next year:
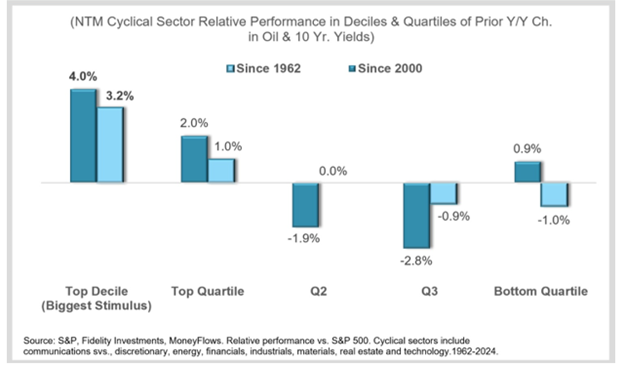
Specifically, cyclicals have beaten the S&P 500 by 4.0% and 3.2% each year since 2000 and 1962, respectively, in this environment.
So, while some of November may have felt emotionally unnerving, we’re again seeing the importance of being consistent through all cycles. It’s an investing imperative.
Making emotional decisions as the market takes us for a ride on its natural roller coaster creates the risk of missing out on some (or all) of the all-important 10 best daily market returns of the year.
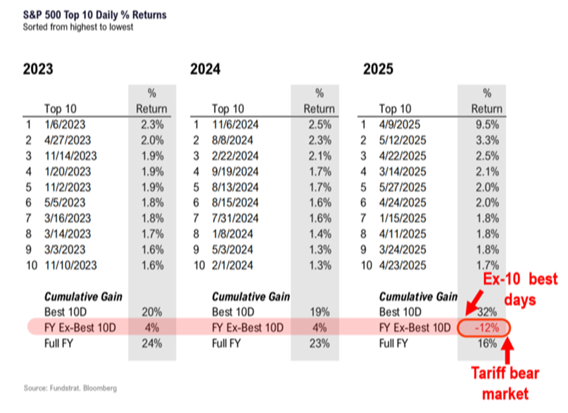
Looking above, the importance of those mere 10 days on your entire annual return is clear. You must be in it to win it.
* Links to third-party websites are being provided for informational purposes only. CoreCap is not affiliated with and does not endorse, authorize, or sponsor any of the listed websites or their respective sponsors. CoreCap is not responsible for the content of any third-party website or the collection or use of information regarding any websites users and/or members.
*Past performance does not guarantee future results.
*Investing involves risk and you may incur a profit or loss regardless of strategy selected.
* The S&P 500 is an unmanaged index of 500 widely held stocks that is generally considered representative of the U.S. stock market.
# The CBOE Volatility Index is a measure of the short-term volatility of the S&P 500 indexes, indicating how quickly market sentiment changes and the level of investor confidence or fear in the market.
^ CAH, CMI, JNJ, ORI, and PH are owned in Cornerstone client accounts.
Securities sold through CoreCap Investments, LLC. Advisory services offered by CoreCap Advisors, LLC. Cornerstone Financial and CoreCap are separate and unaffiliated entities.