


There are indexes and there are markets.
The most popular index is led by a handful mega-cap stocks. The actual market contains thousands of stocks.
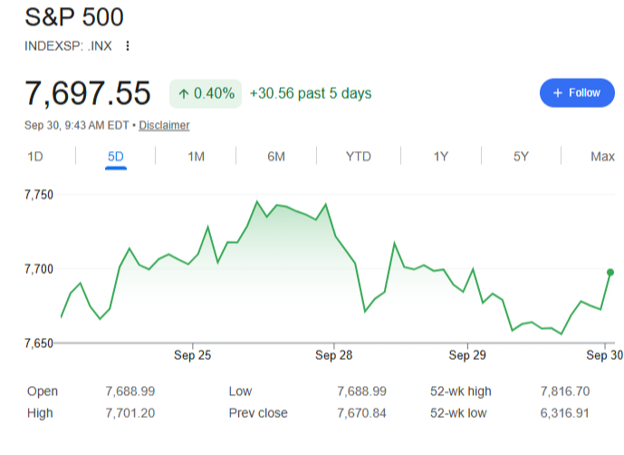
As we know from last week's analysis, right now the index and markets are telling two different stories. As of this writing, the S&P 500 opened around 7,697, which is roughly 1% off its all-time high:
Again from last week, we also know that about 50% of the over 5,000 publicly traded stocks that we track are in bear market territory. That means these company’s shares are sitting at 20% or more below their 52-week highs.
We can understand this divergence only by knowing how to look underneath the surface to identify and analyze the data. It shows us where institutional investors are moving their money and placing their bets. This type of analysis is especially important in the current environment where bond yields continue to surge.
The 10-year Treasury crossed 5.2%, its highest level since 2007:
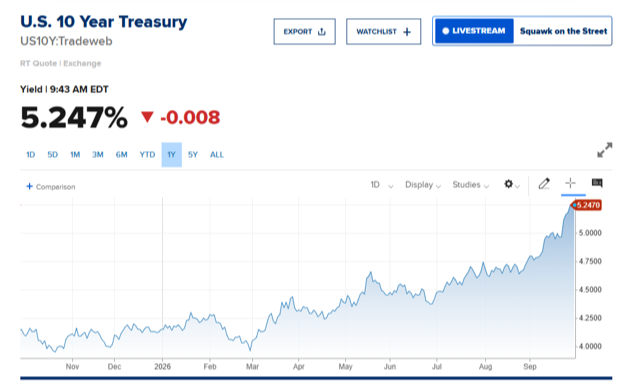
When super safe bonds pay that much, anything else paying a yield struggles to compete. Over the past couple weeks, we’ve seen this dynamic play out underneath the surface.
For example, recently exchange-traded funds focused on corporate bonds had 173 outflows versus just two inflows. Additionally, other interest rate sensitive sectors struggle. Examples like real estate equities saw 92 outflows with zero inflows. Utilities had 74 outflows with only one inflow. Banks and insurers had 73 and 46 outflows, respectively.
The median stock bought during the same time paid no dividend, while the median stock sold yielded 2.2%.
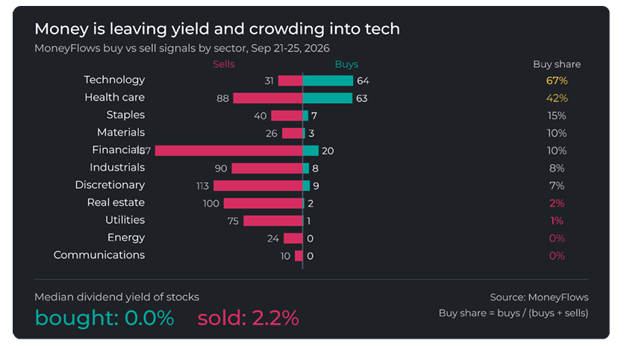
So, where were institutions moving their money? Below-the-index data tells us technology was the only sector with more buying than selling at 64 inflows versus 31 outflows.
A divergence is happening. “Big money” is picking winners, not buying entire sectors, and rotating quickly out of the most rate-sensitive stocks.
Underlying Waves Have Been Rolling for Weeks
The past couple of weeks may have seemed to be increasingly “noisy.” As always, the objective data allows us to see through those unnecessary distractions. Most importantly, it clearly shows how institutional money has tracked the bond market almost daily.
We've seen selling spike on days where yields jump and ease on days when the price of oil or rates fall. What's most unique about this current dynamic is how significant the divergence between what is happening underneath the surface is in comparison to the indexes.
For example, through last Tuesday, 10 of 11 trading days had 100 or more outflows, nine of which were consecutive. That tied for the fifth longest streak since 1990. Historically, in the 10 prior streaks of eight sessions or more with this level of selling, the S&P 500 fell every time.
But this time it rose. That's the index hiding the market.
Taking a step back, we can see clear damage to markets just by looking at how quickly MoneyFlows’ trusty Big Money Index (BMI) fell since late August. As of last Wednesday, this measure of institutional activity fell from 69.2% in late August to 34.6%.
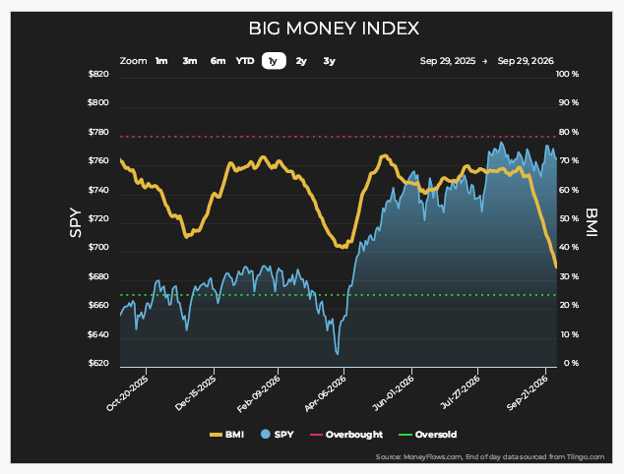
If this continues, we expect the BMI to reach oversold status Oct. 6-9. Any of our long-term readers know that when the BMI reaches oversold levels, it indicates the market is a screaming buying opportunity. As an aside, fortuitously this aligns with our normal scheduled Q4 2026 portfolio rebalancing/trading. Similar timing to this years Q2 rebalancing schedule in advance of the record setting Q2 equity performance we experienced.
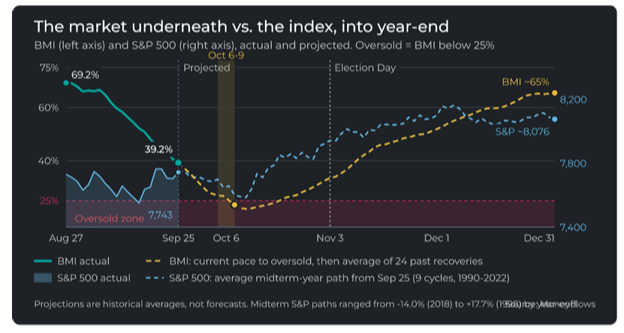
There is no guarantee the BMI will reach oversold, though. If selling eases, then the current trend could set a bottom in the high 20s rather than breaching the oversold 25% level.
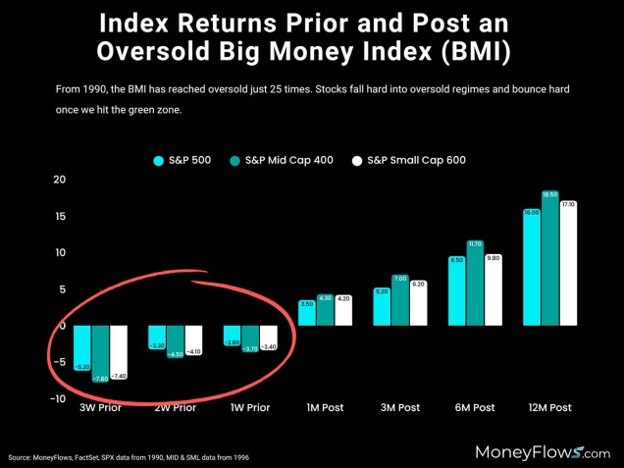
But the current case indicates we will reach oversold status. And history tells us that in the 24 oversold instances since 1990, the S&P 500 was never within 5% of its high. If it happens now, it would be a first.
If or when selling bottoms out by mid-October, we know that what comes after is extraordinarily strong. Leading historical projections from each midterm-year low show the S&P 500 averaged a rally of 15% six months later and 21.2% a year later with a 100% hit rate.
Interestingly, the current pace of the BMI heading towards oversold also happens to coincide with the clustered majority of midterm market troughs since 1990. These days landed in the Oct. 2-15 period:
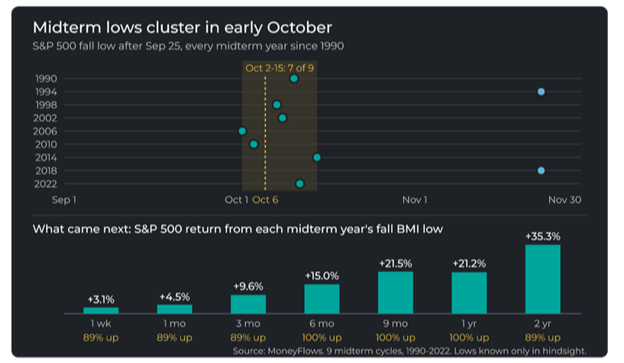
This year could make it eight out of 10.
These underlying waves have been rolling for weeks now. And the current data tells us we're much closer to coming out the other end rather than being near the beginning.
Looking Ahead
Last week we received the first new foundational data point to support additional equity tailwinds through the end of the year – much cooler personal consumption expenditures (PCE) inflation data (the PCE is the Federal Reserve’s preferred inflation measure). A data point we previously wrote that we expected to come to fruition. It immediately caused expectations for an additional rate increase to drop last Wednesday morning.
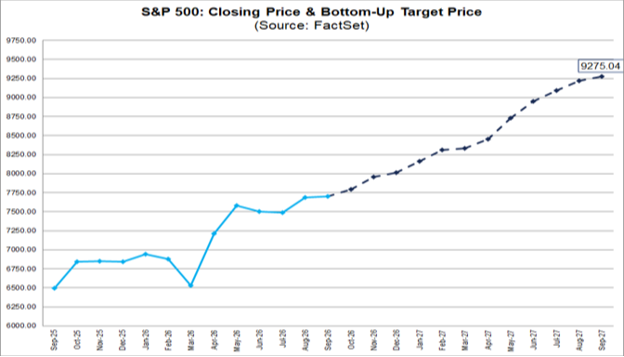
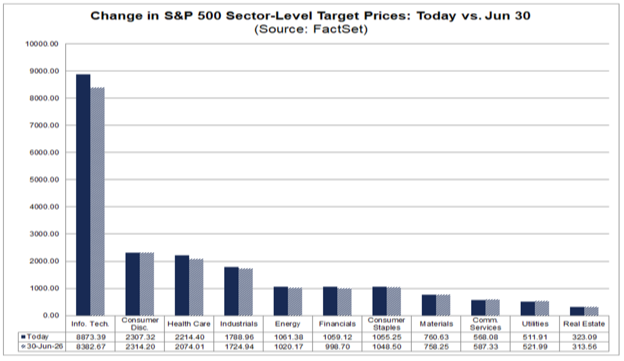
Additionally, even in the face of the most recent rate increase, FactSet analysts in aggregate now predict the S&P 500 will increase in price by 20.4% over the next 12 months. That indicates a bottom-up target price for 12 months from now of 9,275.04:
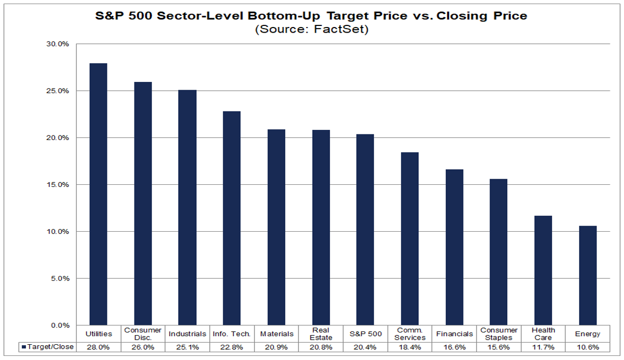
Additionally, analysts now think all 11 sectors will see a price increase of over 10% each, which would be extraordinary market growth.
Even in the face of seasonal weakness, analysts increased this targeted projection by 3.6% since June 30:
This aligns with the historical timeline shown earlier – expect forward returns after an oversold BMI:
As we prepare for rebalancing and reallocation going into the fourth quarter, historical data is also clear that as we come out of this current environment, quality growth stocks win time after time:
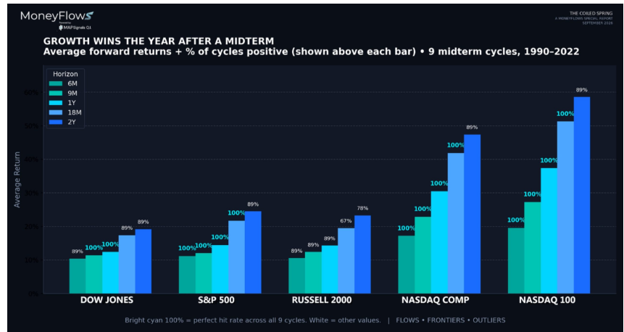
While the index looked calm, the market underneath sustained real damage. But recent data tells us the damage is closer to its end than its beginning. As such, we should prepare for quality growth to lead the way once again.
*Links to third-party websites are being provided for informational purposes only. CoreCap is not affiliated with and does not endorse, authorize, or sponsor any of the listed websites or their respective sponsors. CoreCap is not responsible for the content of any third-party website or the collection or use of information regarding any websites users and/or members.
*Past performance does not guarantee future results.
Securities sold through CoreCap Investments, LLC. Advisory services offered by CoreCap Advisors, LLC. Cornerstone Financial and CoreCap are separate and unaffiliated entities.