

With equity markets, the biggest shifts rarely show themselves in dramatic fashion. As we've been discussing for a few weeks now, these shifts typically take place underneath the surface.
It happens as capital rearranges itself while the macro indices that most people pay attention to appear to be doing nothing significant. The beginning of this year is another perfect illustration of this dynamic.
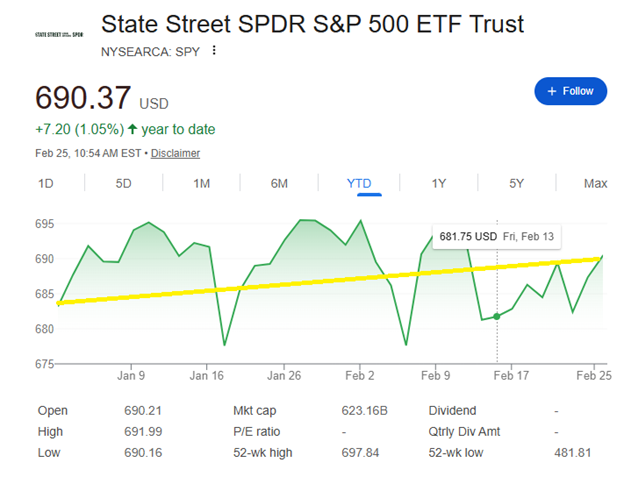
In 2026, the S&P 500 has essentially been flat:
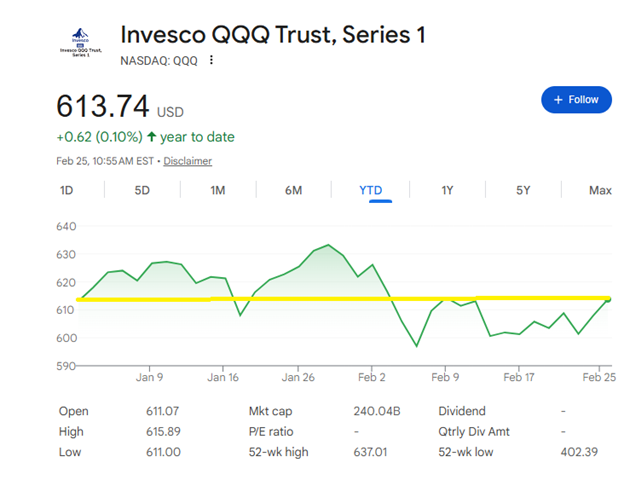
The Nasdaq 100 has basically done nothing either:
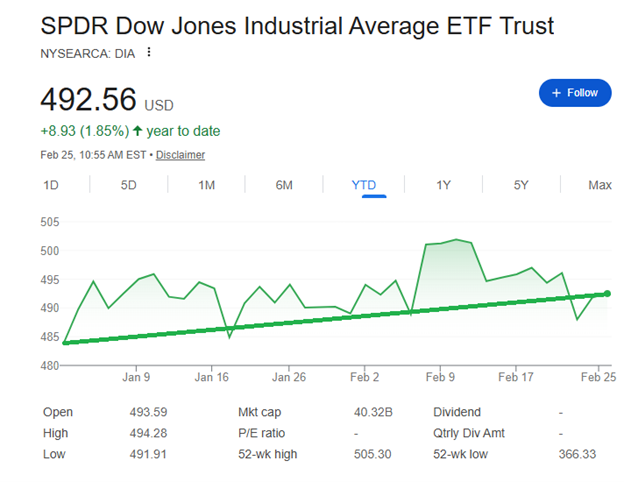
The Dow Jones Industrial Average, a relatively unloved index in recent years, has ticked up slightly:
And the small-cap laden Russell 2000, which has trailed larger stocks for a long time, has been the best of the bunch compared to the others:
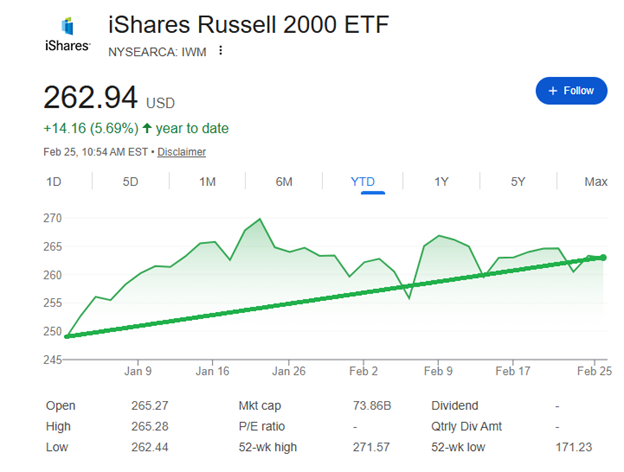
So, at this index level, we can see how groups of larger stocks slanted toward technology have been stagnant as value-oriented and smaller stocks have gained.
Furthermore, MoneyFlows’ trusty Big Money Index, which is a 25-day moving average of netted institutional investor activity, is sitting slightly above 65%:
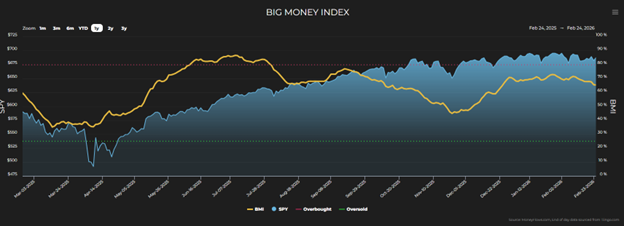
That means over 65% of unusually large trades over the past 25 days were inflows. This confirms the rotational dynamic.
Comparatively, the 20-year average reading for the BMI is 61.8%. So, it may not seem like it right now, but buyers are active.
If that’s true, why is the S&P 500 flat? It’s because capital isn’t leaving the market, but changing its address.
Digging further, it’s clear that since 2026 began, there’s been a healthy mix of inflows and outflows:
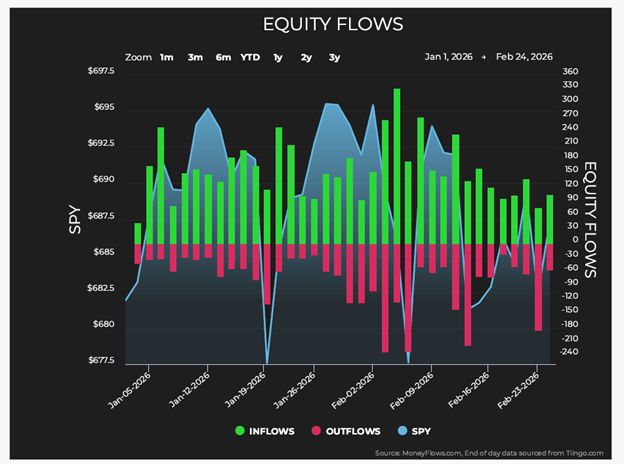
While inflows have outnumbered outflows, the back-and-forth has been keeping the BMI basically flat thus far as well.
Sitting here today, there’s potentially an early indication that this tug of war may be beginning to settle:
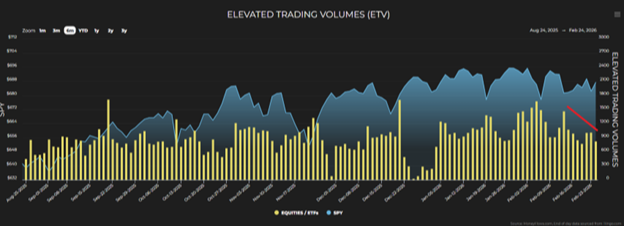
As shown above, elevated trading volumes are cooling off, potentially setting us up at a crossroads.
We’ll need to see more data to confirm the significant underlying rotation is settling. If/when we see it, we’ll know the first couple months of the year weren’t market abandonment, but redistribution.
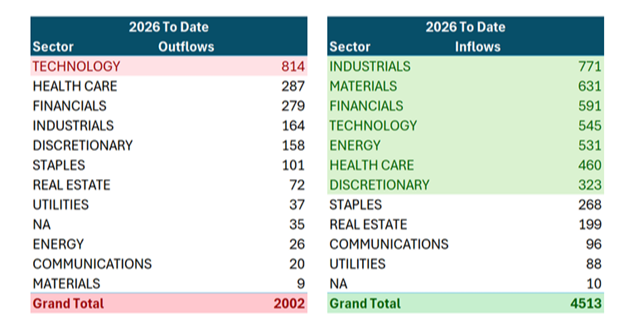
This makes sense because money has flowed out of technology and into cyclical sectors like industrials, materials, financials, energy, and health care since Jan. 1:
While possibly beating a dead horse, we think it’s eternally important to understand that when looking at industries within sectors, any narrative supporting macro technology weakness isn’t telling the whole story.
The damage is concentrated – 80% of all technology outflows have been in software and internet and data services:
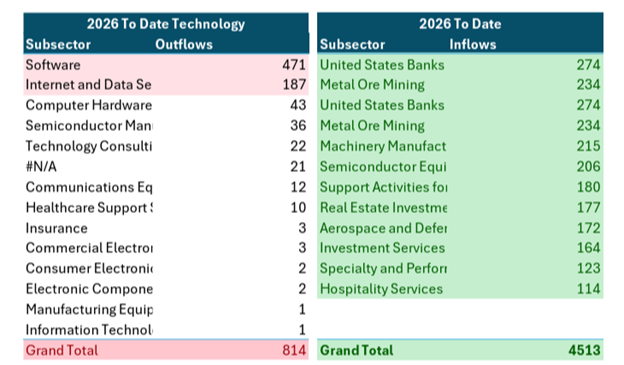
Conversely, inflows have been broad across many newly loved, cyclical subsectors. Capital is flowing to the productive core of the economy, like banks, capital goods, energy, defense, and semiconductors.
This capital isn’t running and hiding. It’s rotating from last year's crowded growth trades into cyclicals and real asset exposure.
Interestingly, it appears the smart money was ahead of the game one again. The inflows began months in advance of the recent Supreme Court decision to strike down this administration’s tariffs.
That decision directly and positively affects the types of industries seeing inflows by reducing friction and providing clear corporate visibility on input costs and supply chains. So, the tariff developments will only reinforce where the capital has been following for months.
While the headline noise was that investors were abandoning growth, the money flows reveal the truly bullish positioning underneath the surface.
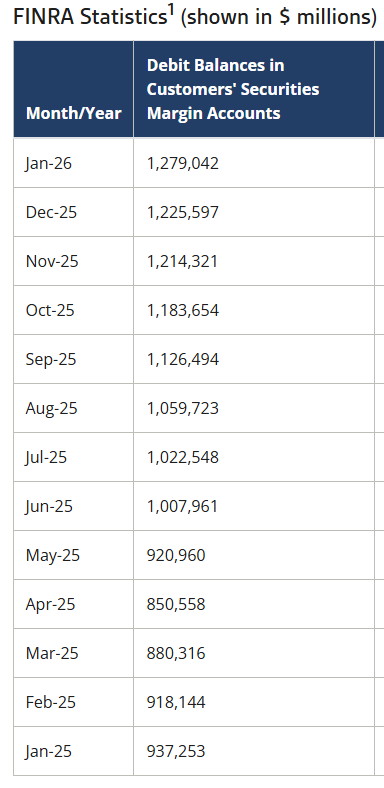
An additional contribution to some of the early year volatility can be understood when you consider where some of the largest embedded gains of the past several years have been. An example of this is the software subsector. It’s been a clear target for harvesting gains. That became more pronounced as prices dropped, triggering a significant number of margin calls by brokers.
This dynamic was amplified over the last couple of months because margin debt had increased to near record levels:
As liquid, profitable names became sources of cash, fundamentals remained intact. As of Friday, 90% of S&P 500 companies reported earnings and 75% of them beat earnings estimates.
While many people became emotionally nervous about the technology sector, tech’s fundamentals advanced the sector’s lead as the primary driver of growth:
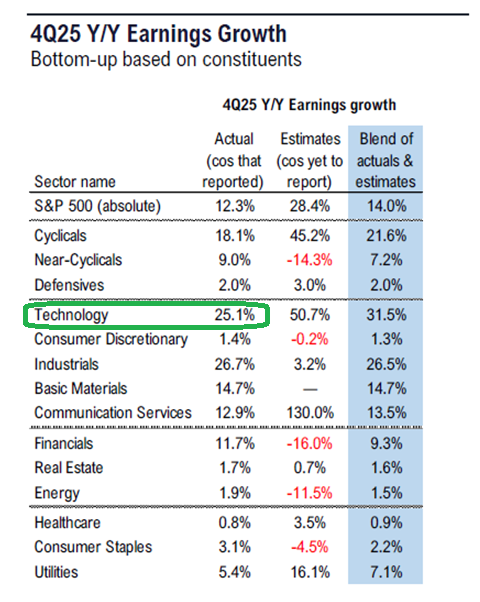
Actual year-over-year earnings growth for tech is an eye-opening 25.1%. And it’s where most of the reputational damage is taking place.
Since Feb. 1 alone, there have been 492 unusually large outflow signals within the tech sector. Of those, 262 were for software companies (53.3%).
Interestingly, the average fundamental strength score of those 262 companies is 65.8%. Comparatively, the average fundamental strength score of the 5,000-stock universe overall is 42.6%.
So, the companies being sold are of higher quality than the average company in the market. This selling reeks of emotional and fear-driven decision making.
This isn’t a situation where speculative companies are being purged. Rather, it’s institutional grade software companies being sold during a rotational liquidity event.
This environment created a contagion, damaging “software” companies that have proven to be dominant adaptive platforms that historically monetized technology changes.
For instance, Microsoft’s* stock price has dropped over 21% in the last six months:
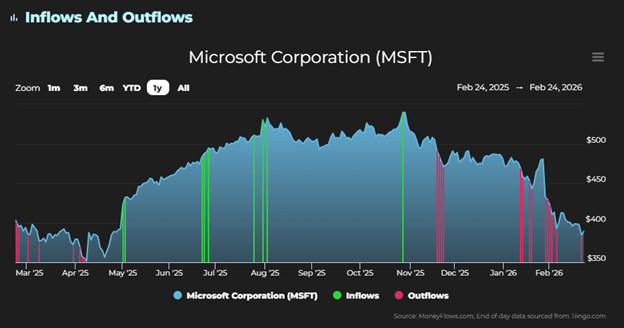
That’s even though the company sits at the center of enterprise distribution and cloud infrastructure. It’s also monetizing its cloud and AI businesses, which will benefit from more adoption.
Another example is Intuit^, which has dropped almost 44% over the last six months:
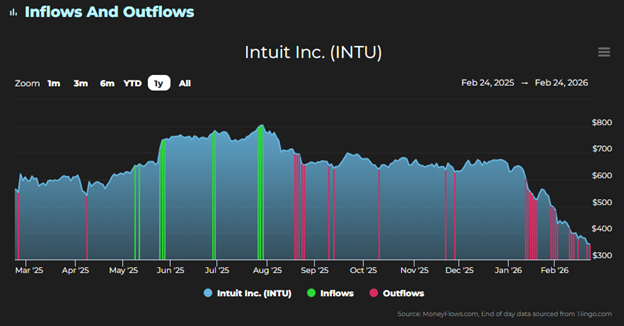
Consider that drop in the context of the company being embedded in tax, payroll, and small business workflows. Those are perfect examples of systems that AI will enhance and help become even more profitable for Intuit, rather than be eliminated.
While rotational phases like this feel uncomfortable because of the leadership change, the data continues to support the year’s first couple months being merely repositioning stress, not structural impairment.
Institutional buyers remain active, as confirmed by the BMI. Capital is finding new homes in shares of companies in formerly unloved areas. They include banks, industrials, energy, aerospace, and more.
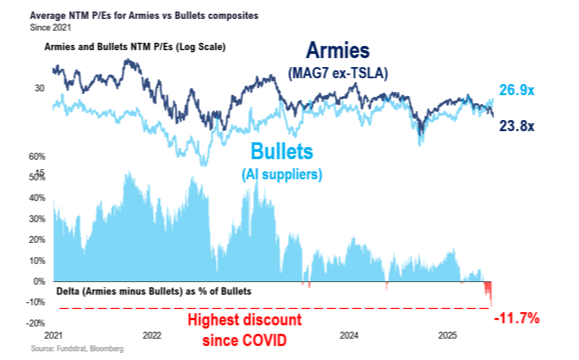
This is further illustrated in the price-earnings ratio reversal that’s been taking place this year when comparing the Magnificent 7 “armies” and the AI supplier “bullets,” as we discussed last week:
History suggests that these phases end abruptly for those who refuse to analyze the underlying fundamental and market data.
* Links to third-party websites are being provided for informational purposes only. CoreCap is not affiliated with and does not endorse, authorize, or sponsor any of the listed websites or their respective sponsors. CoreCap is not responsible for the content of any third-party website or the collection or use of information regarding any websites users and/or members.
*Past performance does not guarantee future results.
*Investing involves risk and you may incur a profit or loss regardless of strategy selected.
* Daniel Milan owns Microsoft (MSFT) personally.
^ No CFS client portfolio or personal ownership of Inuit (INTU).
Securities sold through CoreCap Investments, LLC. Advisory services offered by CoreCap Advisors, LLC. Cornerstone Financial and CoreCap are separate and unaffiliated entities.