

As we entered the beginning of 2024’s last quarter, there was a familiar beginning as equities sold off sharply to start October. It’s the sixth time this year markets declined on the first day of the month.
In each previous time, investors ultimately bought the dip.
To us at Cornerstone, there were three macro headwinds to cause the October disruption.
The first was the longshoreman strikes on the East and Gulf coasts. Number two was Iran launching a ballistic missle attack against Israel, escalating already high tensions. And third was October’s seasonal weakness, especially in election years.
Regarding the strike, it had the potential to be disruptive and extended. Thankfully, an agreement was reached.
In all, it seems it was more noise for an overreaction by inflation-istas and wouldn’t fundamentally change the outlook of the U.S. economy or stocks. U.S. 10-year Treasury yields hardly reacted to the news, meaning bonds don’t see deep damage potentially being reflected yet.
Digging more into the Iranian escalation, remember that any conflict is unpredictable, but even more so if Iran is involved. Usually though, market reactions to escalations don’t tend to last long.
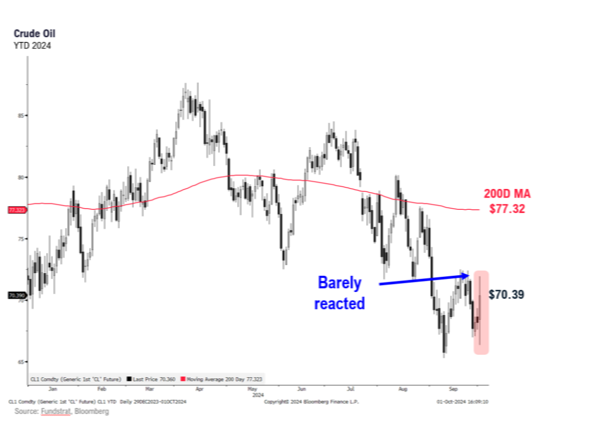
The biggest factor right now is what Israel will do next and if that includes striking economic targets (i.e., oil infrastructure). To be clear, we have no insights. But if markets saw the chance of a major escalation, oil prices would already be rising. Oil prices are historically nervous and WTI crude barely moved:
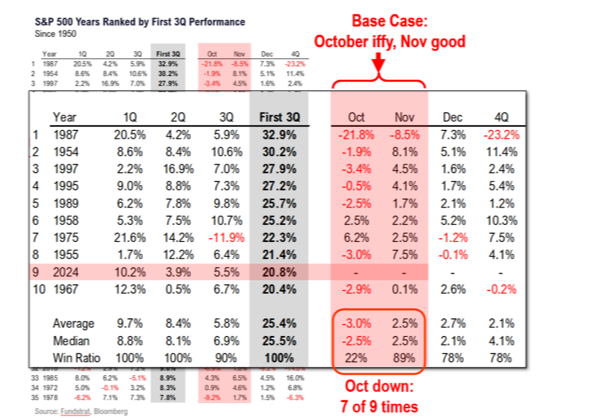
Turning to October seasonality, the S&P 500* is up 21% this year, as of this writing. It’s the ninth best start since 1950. Looking at the 10 best starts through Sept. 30, seven of nine saw declines in October, with the median loss being over 2%. This creates a base case leading into the election where stocks have a higher probability of treading water in October.
Still, 2024 has already been a strong year because investors continue to buy any dips. Based on our research, we think it continues because there are three tailwinds that are much larger and more durable than the three headwinds just mentioned:
- The Fed launching its easing cycle in a non-recessionary environment.
- Stimulus from China’s central bank continues to be positive for markets.
- Post-election dynamics supported by an enormous horde of case on the sidelines:
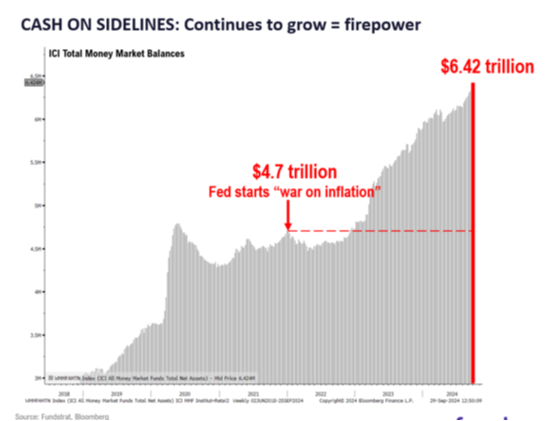
On the last point, total money market balances surged to $6.4 trillion last week (up $130 billion in a mere five days). That balance was only $4.2 trillion when the Fed began its war on inflation.
For these reasons, we think investors will keep buying the dip. In fact, if these tailwinds overshadow the short-term headwinds, there is a clear implied path for the S&P 500 to potentially reach 6,000 by the end of the year.
“Big Money” Has Been Gushing into Stocks
There’s a fourth tailwind to discuss, and it’s a familiar topic for loyal readers – MAPsignals’ Big Money Index (BMI). However, I want to explain the BMI a bit differently than usual and show why it’s reflecting bullishness right now.
Why is the BMI such a powerful market forecasting tool?
Well, traditional measures use conventional metrics like volume, historical fund flows, and holdings disclosures (e.g., Schedule 13D, Schedule 13G, Form 13F) to gauge “big money” investor activity. These are great ways to find out what huge investors own, but only historically speaking, not in real time.
The problem with money flow indicators using these metrics is they are almost always stale. For example, a broker could buy stock for large clients over many weeks, intentionally staying under 5% ownership, then rapidly accumulate shares to get a larger stake that would need to be disclosed. The broker could then wait the legal allotment of 10 days to disclose. But by then, the stock has already shot considerably higher. That example and many like it are why we at CFS think those disclosures are basically useless.
The BMI sidesteps that delay and measures unusually large money flows daily and in real time. Put simply, every day the BMI tracks an expected “bubble” for a stock that includes average price, average price range, volume, and direction. When trading occurs outside of this “bubble,” it’s unusual and creates a buy or sell signal. Smooth that data out over 25 days and you get the BMI.
Knowing a bit more about how the BMI is made, what does it say about the index today?
It’s clear the uptrend that started in mid-July is from outsized money inflows that returned to the market in a massive way:
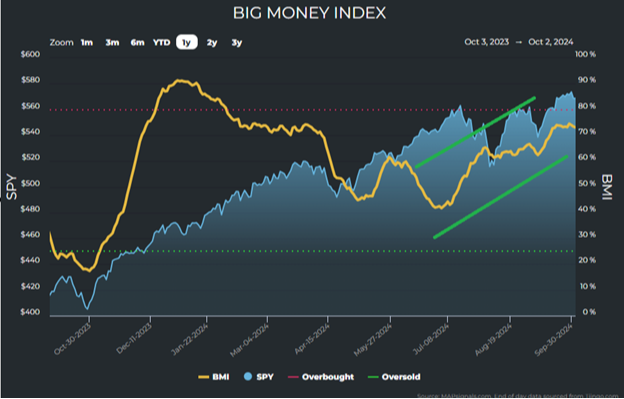
Yes, it’s been a volatile few months, but indexes are hitting fresh highs again with the support of the Fed beginning to lift the weight of high interest rates.
Sept. 18 (when Fed Chair Jerome Powell greenlit rate cuts) marked a clear line in the sand. Since then, “big money” has been gushing into stocks:
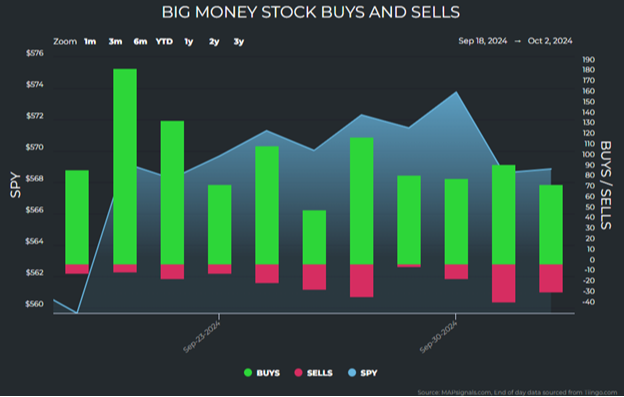
Nine of the 11 S&P industrial sectors have made new six-month highs in the past couple of weeks.
This may all seem overwhelming. So, is there an even easier, thumb-in-the-wind guide to indicate the market’s direction?
Yes, and it shows us a classic lesson: time in the market beats trying to time the market.
What happens when the BMI is over 50% or under 50%? That line is important because when the BMI is above 50%, unusual buying was more than half of the signals over the past 25 days (i.e., buyers were in control).
Since 2004 (5,219 trading days), the BMI was above 50% for 3,873 trading days, or 74.2% of the time. That means the BMI was below 50% (i.e., sellers in control) 25.8% of the time. Here that is in chart form (green is BMI above 50%, red is BMI below 50%), with the S&P 500 included:
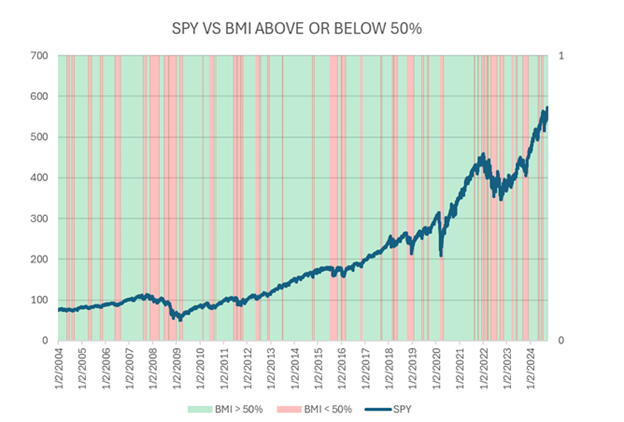
Looking above, it’s clear how timing the market has always been a fool’s errand.
Even with all the headline news hysteria right now, we are not in a red period. We’re in the green and market strength is only gaining momentum on the back of the latest Fed cuts.
* Links to third-party websites are being provided for informational purposes only. CoreCap is not affiliated with and does not endorse, authorize, or sponsor any of the listed websites or their respective sponsors. CoreCap is not responsible for the content of any third-party website or the collection or use of information regarding any websites users and/or members.
*Past performance does not guarantee future results.
* The S&P 500 is an unmanaged index of 500 widely held stocks that is generally considered representative of the U.S. stock market.
Securities sold through CoreCap Investments, LLC. Advisory services offered by CoreCap Advisors, LLC. Cornerstone Financial and CoreCap are separate and unaffiliated entities.