

And suddenly, in the blink of an eye the “big money” fell from overbought.
I’m talking about The Big Money Index (BMI) from our friends at MAPsignals. Regular readers know the BMI is a moving average of “big money” professional investor buys and sells netted out over 25 days.
Last week’s post discussed a possible dip on the horizon. Well, it arrived, and the BMI fell from overbought territory quickly:
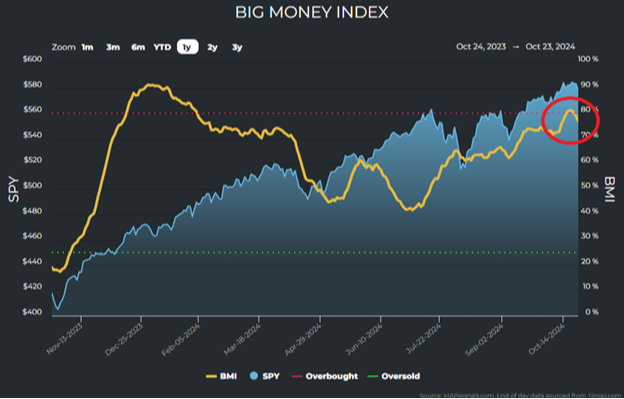
From a data standpoint, this “surprising” turbulence to some actually arrived right on time.
A falling BMI indicates bids are fading and near-term caution is warranted, as we mentioned last week. That said, our medium-term outlook remains favorable for the S&P 500* and stocks generally.
When your mind can't imagine falling stock prices, do like us and turn to data. Sometimes looking backwards helps prepare for the future. Thankfully, the trusty BMI often spots potential inflection points in markets:
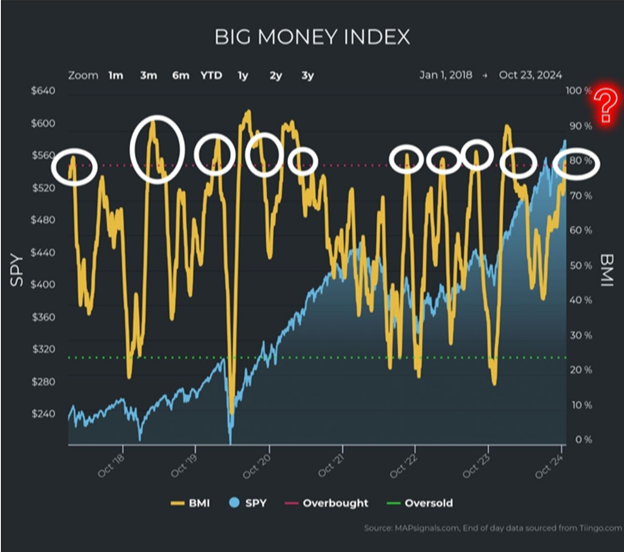
Each time the BMI fell from overbought conditions, the line of truth retreated in a healthy fashion. Notice how the yellow line typically declines fairly abruptly once the 80% threshold is breached.
It’s a repeatable gravitational tug of war. Importantly, it provides the data necessary to be aware of near-term volatility.
Let's unpack this more to grasp what's happening from a supply-and-demand perspective. This is where understanding the “big money” phases is so vital.
Forget the media headlines that change with the wind. Instead, focus on the waves. “Big money” activity falls into four phases at any given time:
- Huge buying and little selling (think early October)
- Buying slows and selling grows (where we are, typically near a short-term peak).
- Buying slows further and selling takes over, creating opportunity (think post-election).
- Buyers are gone, sellers dominate – the best buying opportunities (think one year ago).
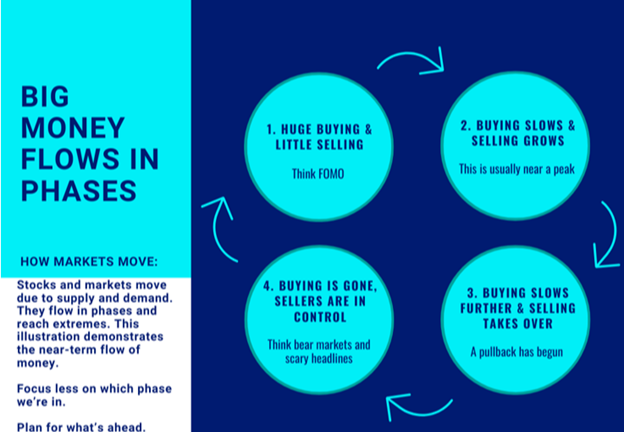
Sometimes we go directly from phase three to phase one, skipping over four.
Before you panic, remember these phases can (and often do) shift quickly. So, it's paramount to follow the BMI in real time, as we discussed last week, especially in an election year. Good buying opportunities arise in phase three, and rarely do we reach phase four – a fully oversold market – but when we do, it’s a full risk-on situation.
It pays to follow the “big money.”
Why then is our intermediate-term case still bullish?
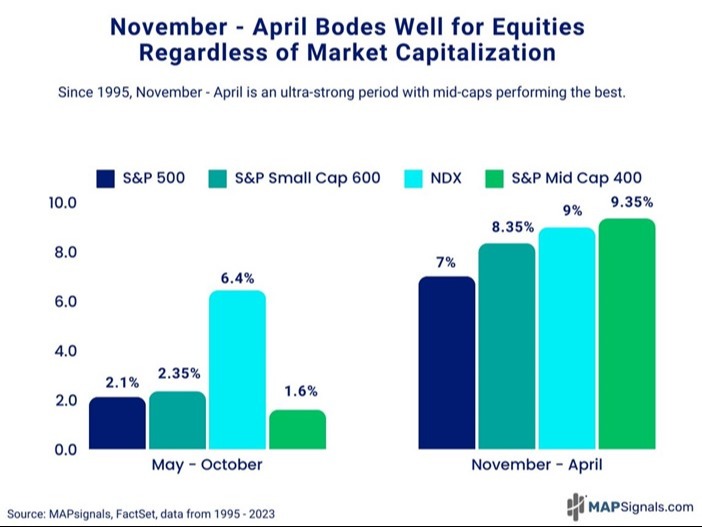
There are a handful of reasons which we will discuss but first is upcoming positive historical seasonality. November to April is a powerful six-month period. Since 1995, this time tends to bring solid returns for every major index, especially mid-caps:
Big Momentum Is Actually a Buy Signal
Let’s highlight other signals that support gains ahead and debunk a couple of the bear-istas’ biggest macro worries.
Here's an interesting tidbit about the stock market: the S&P 500 achieved 46 all-time highs on its approximate 22% year-to-date current run (as of this writing).
But don't let that juicy performance scare you. Big momentum is actually a buy signal, even though these huge gains aren't keeping bears from predicting a nasty selloff.
Bull markets are born in despair, mature on skepticism, bloom on optimism, and finally die on euphoria. This is a time-tested market behavioral evolution that takes an average of four years to play out, not the two years we’ve been in this bull market.
Let's look at history to show just how strong big momentum has been. Since 1990, the S&P 500’s average six-month gain is 4.7%:
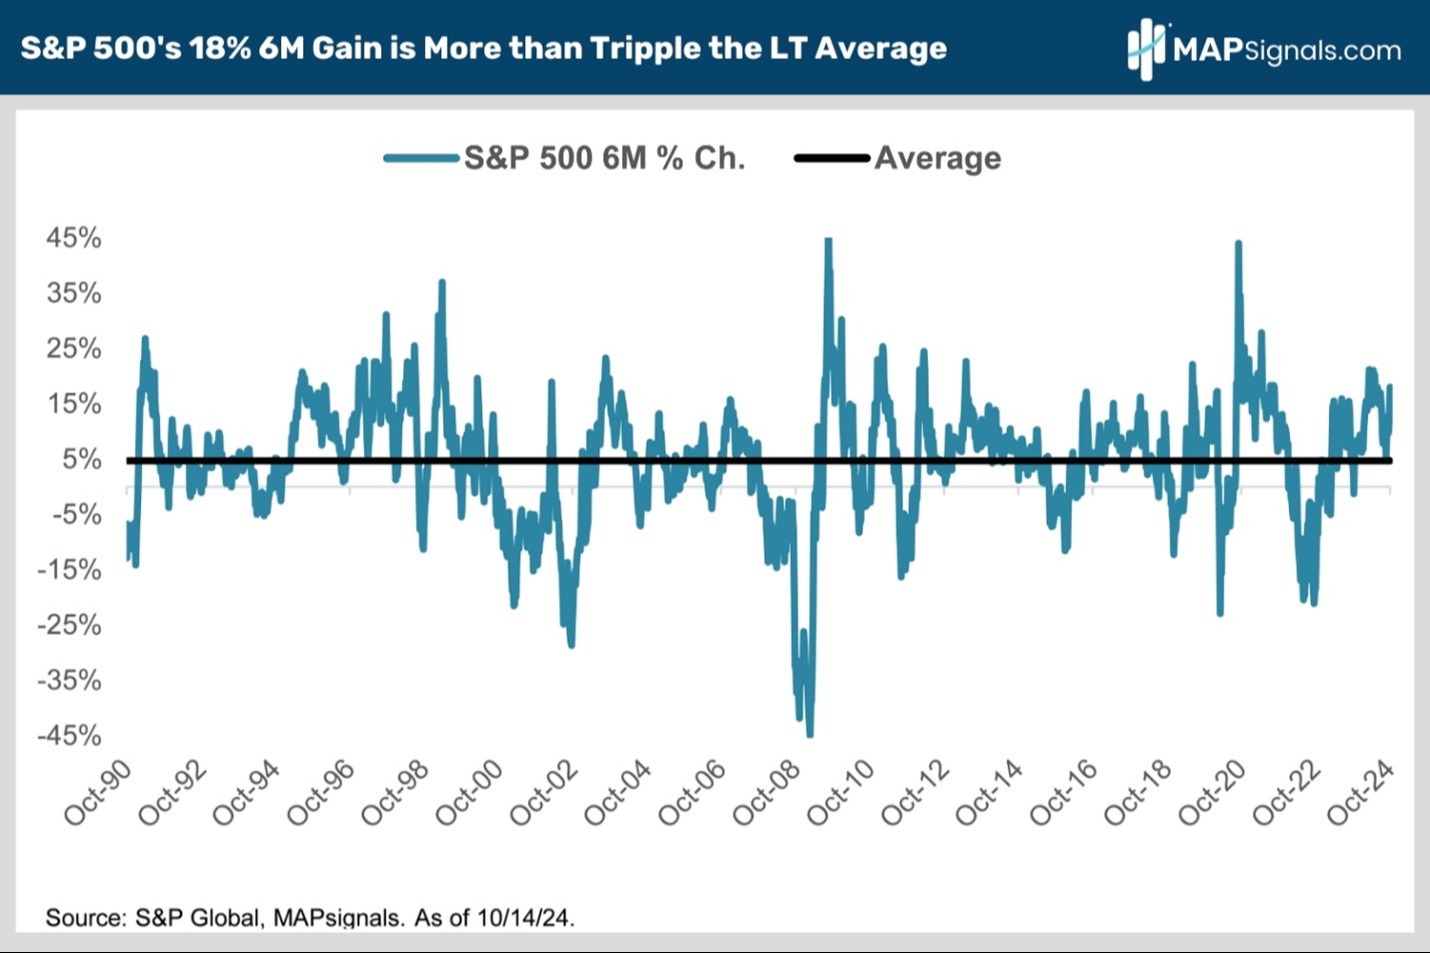
That average performance is less than a third of the 18% this market has delivered since mid-April.
We know it's tempting to cash out after such a massive run, but that would be a mistake. Since 1990, markets that do well keep doing well the year after:
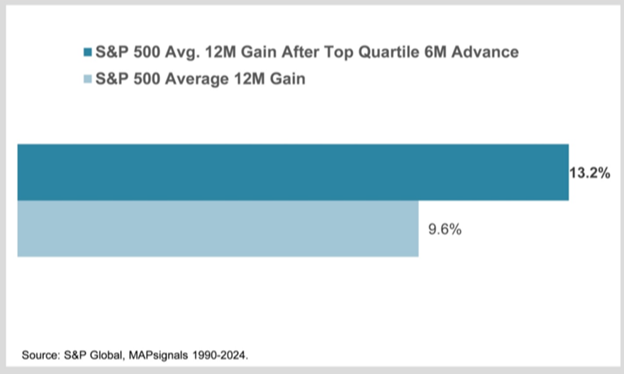
Strength begets strength.
Some of you may remember in April when we made the momentum case as well. Since then, the S&P 500 has gained 18%. A part of our past high conviction was stocks’ strong momentum over the prior six months, which remains today.
Now let’s address some of the bear-istas’ new favorite worries – I'm sure you're hearing these a lot.
First is a slower pace of interest rate cuts. The bears say to sell stocks because the Fed will cut rates slowly, owing to continued economic resilience and the slowdown in inflation's decline. That narrative is what caused the 10-year Treasury yield to pop recently.
But the bears are missing that when easing is slow, stocks fly:
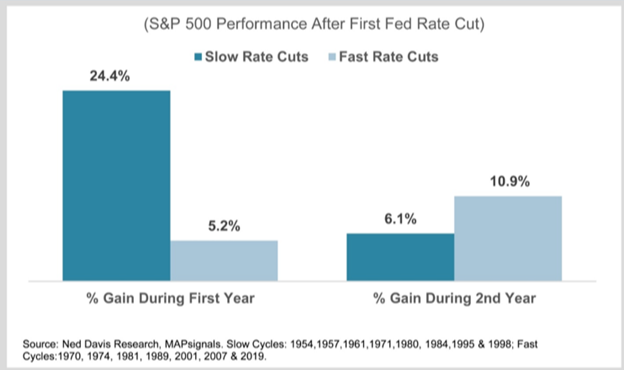
Since 1995, when cuts are slow, the S&P 500 is up 24.4% on average a year later. That's 19% more than the index has rallied to so far after the first rate cut.
Contrast that to fast cuts, when the S&P 500 only gained 5.2% on average a year later. That’s well below the 10% historical average gain.
Why is this?
When the Fed cuts quickly, it usually means crisis. That's not the case today.
The latest third-quarter GDPNow growth forecast from the Federal Reserve Bank of Atlanta shows economic growth of 3.4%. And inflation fell to 2.4% in September, which is the lowest reading since the 9.1% peak in 2022.
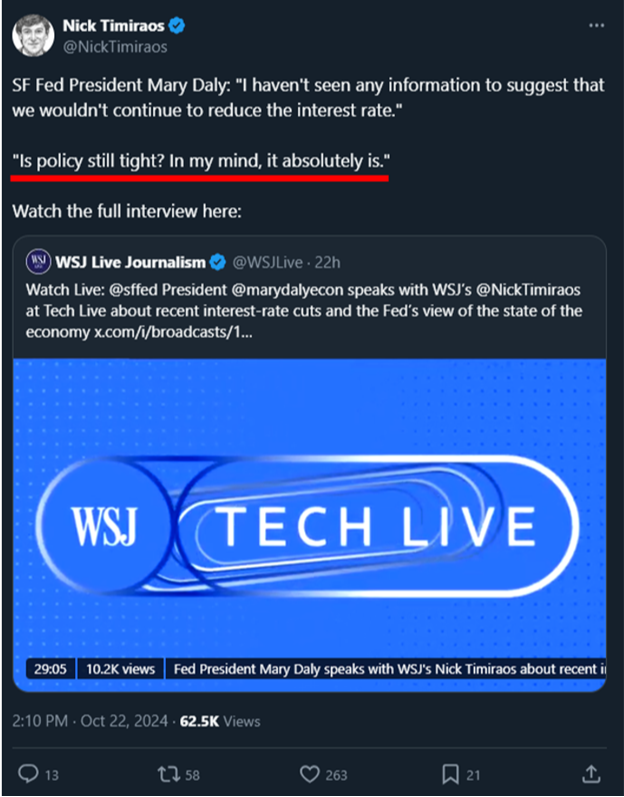
Plus, the Fed itself disagreed with the bears:
This all creates a macro picture pointing to gradual easing. And clearly that’s been favorable for stocks.
Another bear-ista worry is the recent reversal in long-term interest rates, where the 10-year yield jumped to 4.1% from September's 3.6% low. They argue this means “higher for longer” rates and equities declines.
First off, anyone with a brain knows why rates are rising is what matters.
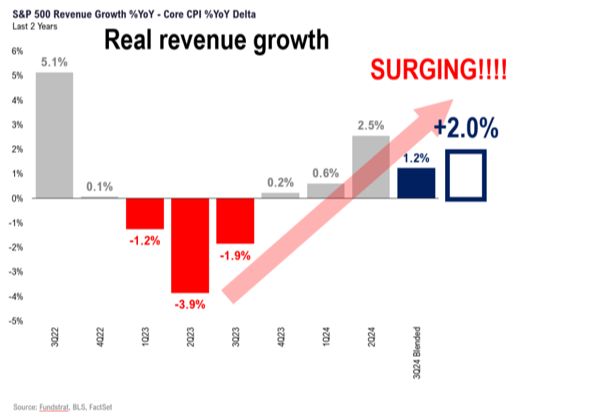
Long rates aren't up because of spiking inflation. They're up because the economy is stronger, and it’s reflected in this earnings season. Once again, the table from last week about real revenue growth:
Furthermore, history shows long-term rates shouldn't go much higher. Since 1955, when inflation is between 2% and 4% (like now), 10-year Treasury yields have been extraordinarily stable:
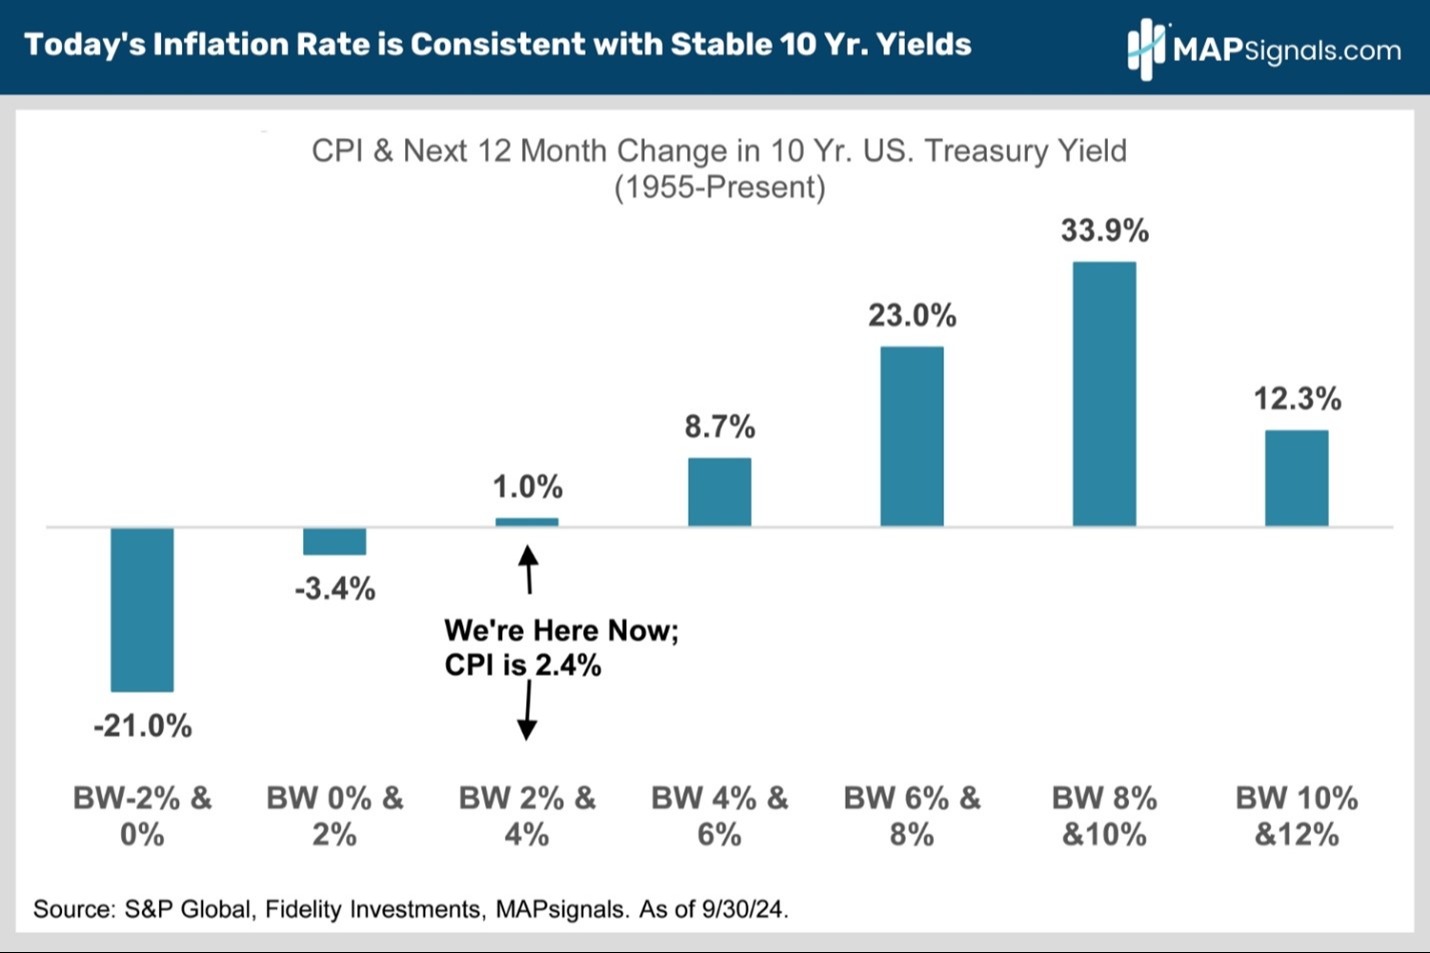
So, there’s a good chance long rates aren't rising with inflation this low, regardless of how much pundits disagree.
Now you see the opportunity.
With election bombs hitting daily, don't be surprised of market gyrations.
But now you know what follows.
Opportunity knocks. Election jitters tend to fade after the vote.
* Links to third-party websites are being provided for informational purposes only. CoreCap is not affiliated with and does not endorse, authorize, or sponsor any of the listed websites or their respective sponsors. CoreCap is not responsible for the content of any third-party website or the collection or use of information regarding any websites users and/or members.
*Past performance does not guarantee future results.
* The S&P 500 is an unmanaged index of 500 widely held stocks that is generally considered representative of the U.S. stock market.
Securities sold through CoreCap Investments, LLC. Advisory services offered by CoreCap Advisors, LLC. Cornerstone Financial and CoreCap are separate and unaffiliated entities.