

The long-awaited day is finally here. I’m talking about the start of easing by the Federal Reserve.
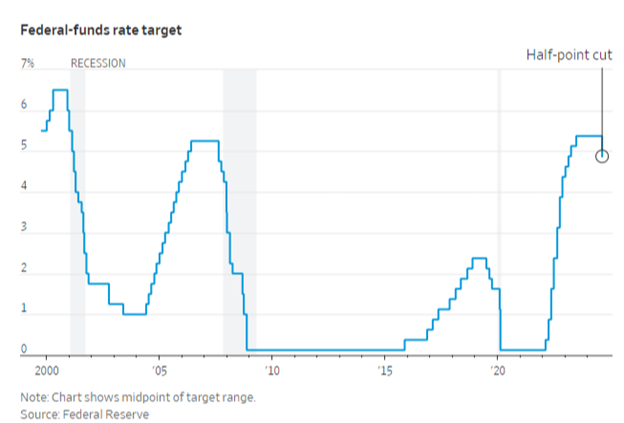
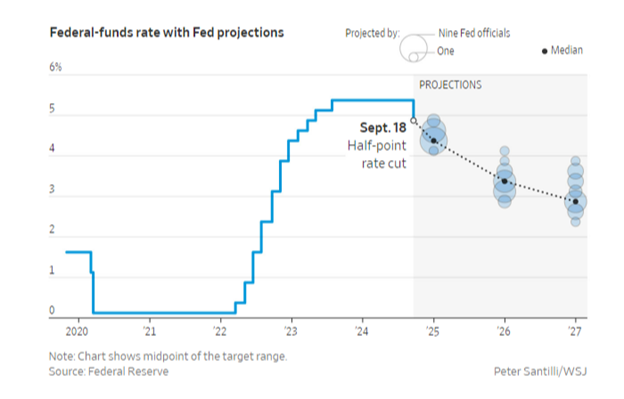
Last week, the Fed started interest rate cuts. That said, the central bank surprised people a bit by beginning with a 50-basis-point cut instead of just 25.
The “Fed put” is back, meaning the organization’s mandate is now primarily supporting the labor market. Remember that July and August jobs reports showed a slowing labor market. If it weakens too much, it could trigger a contraction cycle, which is something the Fed will actively work to avoid.
To be sure, the key to a healthy economy is keeping consumers and business leaders confident. If CEOs are cautious, then they’ll defer spending activity and expansion, which has been their playbook since rates initially shot up. And it’s now the psychology the Fed wants to reverse.
In our view, a good barometer of this is the stock market. If stocks were to fall significantly, it will almost guarantee a recession. So, cutting rates is one of the best tools for the Fed to create that floor (or “put”) to support equity markets overall.
This hasn’t always been the case.
In 2022, the Fed found the near 27% low point decline in stocks as supportive of their attempts to control inflation. However, the opposite is true today.
Some may think markets have already priced all of this in and the “Fed put” will not be supportive of stocks moving forward. We disagree for three reasons.
First, in the past 50 years, stocks have reacted positively to Fed cuts when the economy wasn’t landing into a recession:
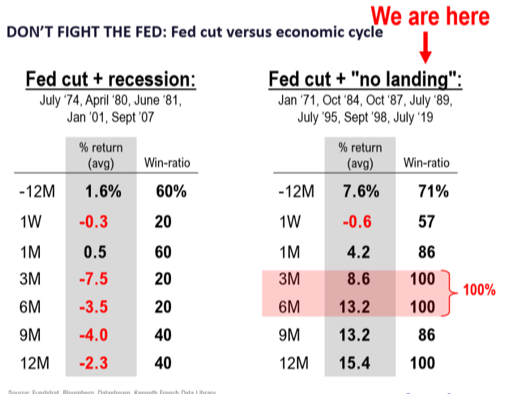
It's hard to argue against history.
Second, if you’ve watched the news recently, there are plenty of investors, pundits, and figureheads saying the U.S. is already in a recession. In our contrarian opinion, that alone is enough to allow room for a positive surprise.
Lastly, we’ve mentioned before how there are recessionary parts of the U.S. economy, like durable goods, automobile sales, and housing sales. For these areas (and ones like them), the Fed’s rate cuts will be a bona fide tailwind:
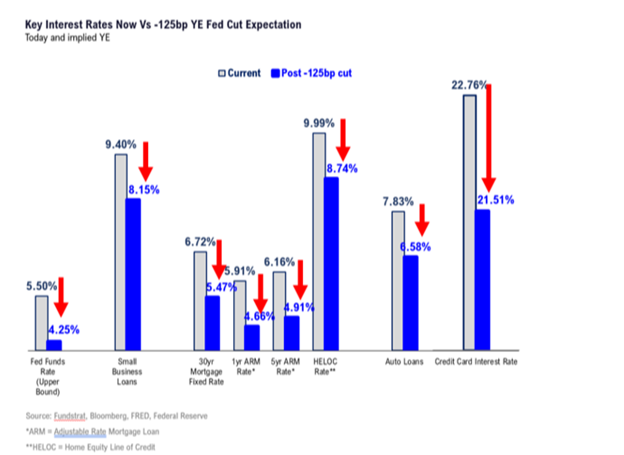
The most important tailwind is the real-life effect on affordability in major areas (e.g., business loans, mortgages, auto loans, etc.) due to implied decreases in financing costs. The effect is vast, but it can take time to unfold.
Are Decreasing Rates Bad for Stocks Now?
Now that we understand the potential economic effects of this transition, what does it look like for the “bear-istas” still out there from an equities standpoint?
Traders often overcomplicate market price action. That was the case with last Wednesday's wild ride, when major indices were up triple digits during the Fed presser only to reverse and finish flat.
On the surface, stocks appeared to stall, which helped the “bear-istas” confidently come out of the bushes, saying rate cuts are bad for stocks. But digging deeper, from an institutional standpoint, the action was extraordinarily bullish.
Simply put, interest rates cuts are historically good for the economy as they spur economic growth and lessen the burden for businesses and households. Pretty simple, right?
But it can get more complicated given recent history, as bears love to point out. There have been a few instances where rate cutting has been disastrous for stocks (e.g., dot-com bubble, Great Financial Crisis, COVID-19).
But are decreasing rates bad for stocks now?
Well, going back to 1990, there were nine Fed rate cutting periods:
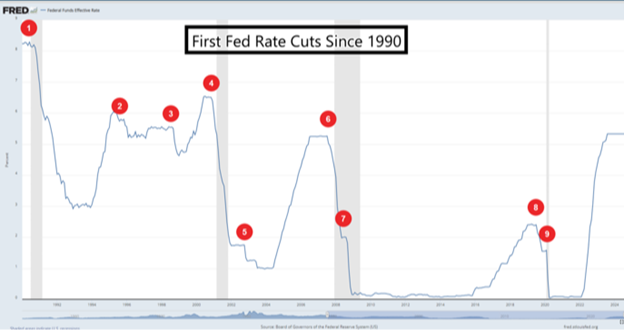
- July 1990, Gulf War
- July 1995, mid-cycle adjustment
- September 1998, global currency crisis
- January 2001, dot-com bubble
- November 2002
- September 2007, housing crisis
- October 2008, global financial crisis
- August 2019, mid-cycle adjustment
- March 2020, COVID-19
Unfortunately, many talking heads like to solely focus on a few big global panics to stir emotions. But the reality is, when including all nine of these initial rate cutting episodes, the S&P 500* jumped an average of 7.7% a year later. Keep in mind this includes the Global Financial Crisis and dot-com crash.
Why is this important in the current environment? Because some seem to be teetering on the edge of panic, like those few outlier periods already mentioned. To ease this news-based panic, let’s turn to more evidence.
Forward returns for the major small-, mid-, and large-cap equity benchmarks are quite good following the Fed’s initial rate cuts since 1995 (that is when the small- and mid-cap equity benchmarks began):
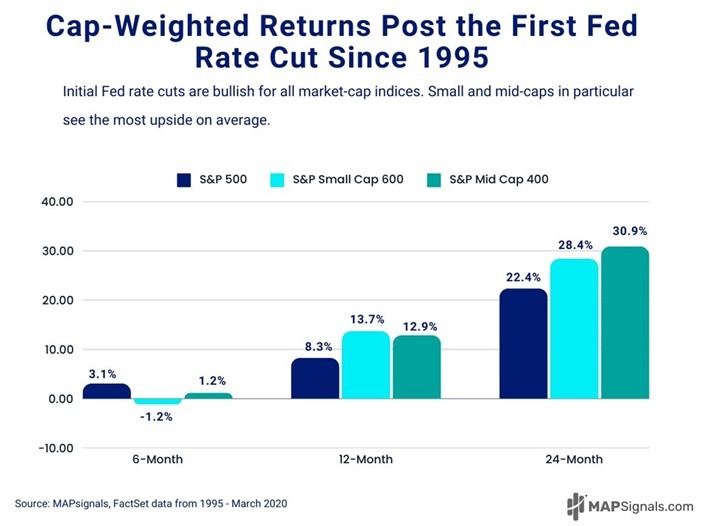
As we've discussed, Fed rate cuts are especially supportive for smaller businesses that are more sensitive to debt on their balance sheets affecting profits. Thus, lower rates end up flowing through to the bottom lines of smaller firms. The returns above reflect that phenomenon.
Digging one level deeper, we can already see the smart money placing bets.
It's one thing to look backwards for historical guidance. But it's another to see the risk-on action taking place in real time. This is where the “big money” stands now:
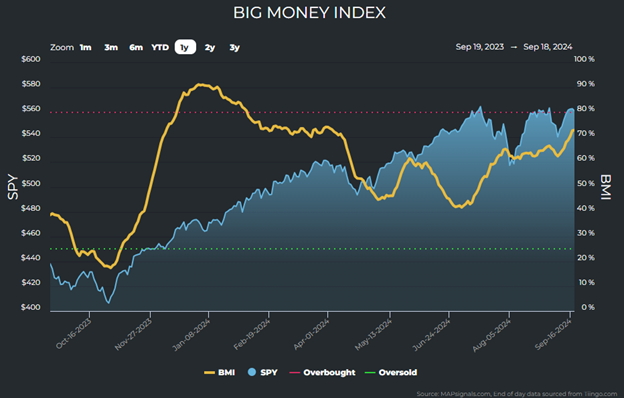
MAPsignals’ trusty Big Money Index (BMI), which is a 25-day moving average of netted buys and sells by “big money” investors, has been trending up in advance of the rate cutting cycle beginning. That means institutions have been buying stocks by the handful.
Before you fall for the news media's scare tactics about Wednesday's weakness into the close, consider the following chart. It shows how Wednesday was a 91% buy day:
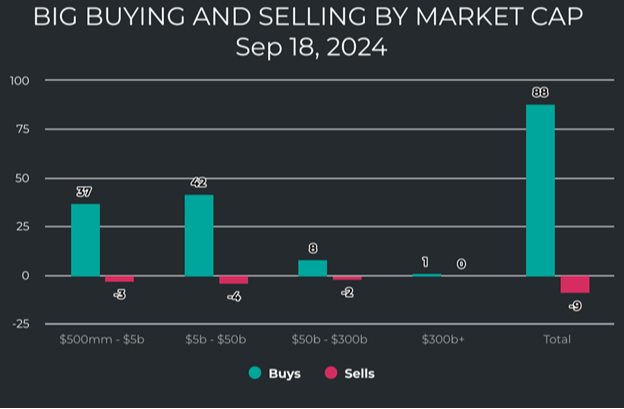
Finally, Sept. 18, hasn’t been the only “big money” buying day for stocks. In fact, it began a week prior to Powell’s announcement on Sept. 18:
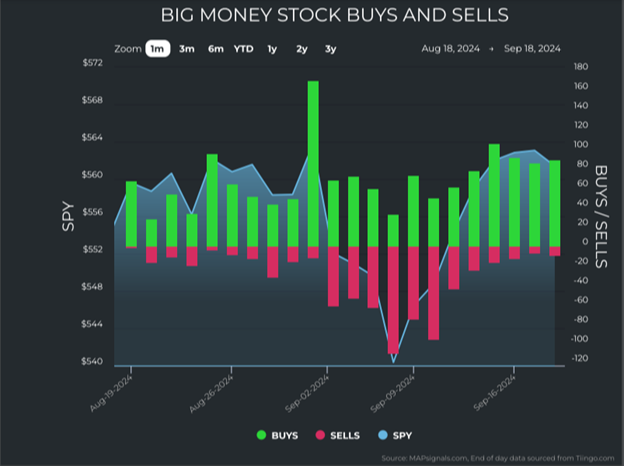
This is a clear indication of significant “big money” inflows into stocks ahead of the standard retail investor…just like always.
* Links to third-party websites are being provided for informational purposes only. CoreCap is not affiliated with and does not endorse, authorize, or sponsor any of the listed websites or their respective sponsors. CoreCap is not responsible for the content of any third-party website or the collection or use of information regarding any websites users and/or members.
*Past performance does not guarantee future results.
* The S&P 500 is an unmanaged index of 500 widely held stocks that is generally considered representative of the U.S. stock market.
Securities sold through CoreCap Investments, LLC. Advisory services offered by CoreCap Advisors, LLC. Cornerstone Financial and CoreCap are separate and unaffiliated entities.