

First things first, as we at Cornerstone look back at 2025 so far, we acknowledge our theme appears to the “Cornerstone Contrarian.” But we didn’t feel contrarian at the time because our job is to rely on objective data to guide our analysis, forecasts, and decision-making.
As the market continues to meander through the historical seasonal weakness of August and September, today we’ll analyze and discuss some increasingly upbeat macro data points that were surprising, even to us.
As we know, August began with increased volatility right on schedule with historical norms. Now as we approached the end of August, interestingly we’ve noticed that the S&P 500* had bounced off its 20-day moving average twice in August so far.
We point this out because it’s an uncharacteristically strong key support level, historically, for this time of year. In fact, that’s been the case since April tariff lows:
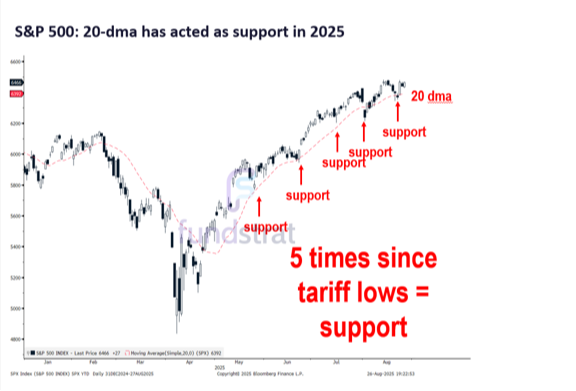
This type of tactical support proved to be the initial foundational indicator showing the risk/reward analysis for stocks remains positive looking forward through the intermediate term. More on this in a bit.
While early in August bear-istas seemed to finally be having their moment, the misery-loves-company crowd keeps ignoring the current underlying positive technical indicators and the overall strength in the macro data. Many pundits have loved to discuss the all-too-common “recession” threat, but objective data has continued to refute that narrative.
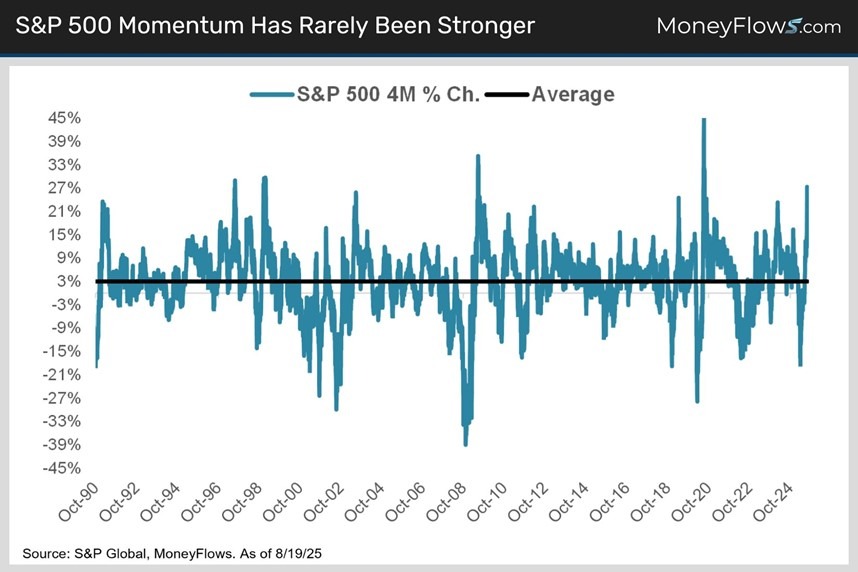
Let’s discuss contrarian data. It shows huge rallies (like we have experienced since April) typically precede both strong economic growth and additional market gains.
As of this writing, even in the wake of early August profit taking, the S&P 500 is still up approximately 28% since the lows after the tariff announcements in early April. There's no other way to describe this rare run other than epic.
Rallies of this magnitude have only happened a handful of times in such a short time period:
While some will argue that reversion to the mean is inevitable, historical data says otherwise. Why? Remember that markets are forward-looking pricing mechanisms. They often clearly see what the future holds well in advance.
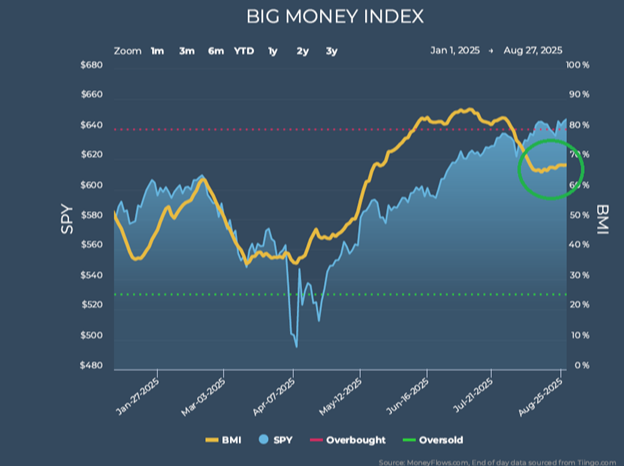
That’s why rallies tend to take place before the economic outlook improves, not after. It’s why the “big money” data from MoneyFlows’ trusty Big Money Index is so powerful in contradicting prevailing narratives not founded in data.
No wonder there are so many anxiety-ridden pundits who have been screaming from the mountaintops recently. We have interestingly noted that after the initial fall of the BMI in early August, the index quickly flattened in the second half of August:
This action has been a direct result of early outflows not lasting too long:
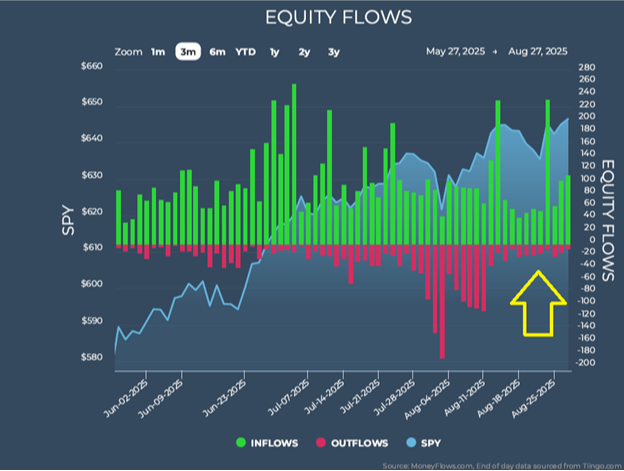
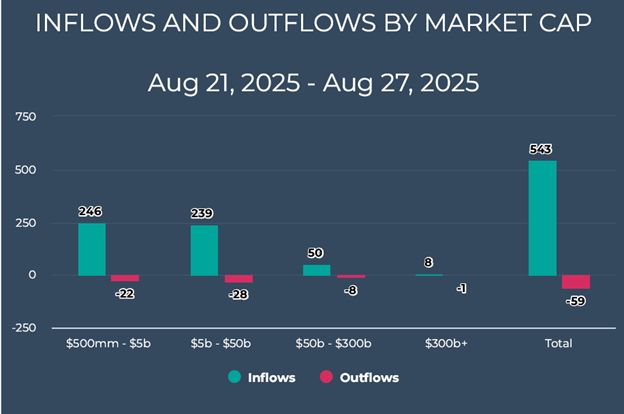
We even saw big inflow spikes in exchange-traded funds:
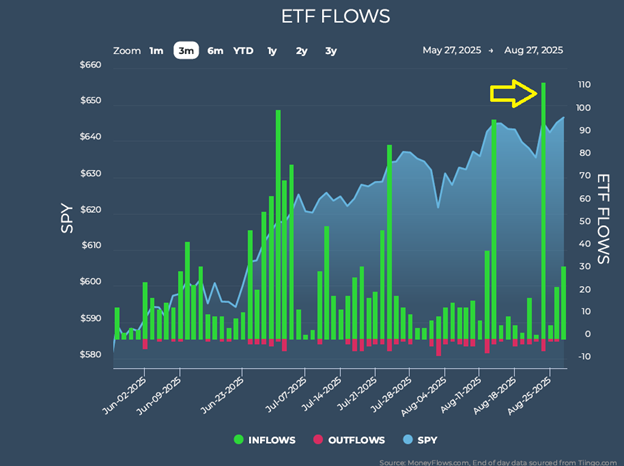
The sharp reversal has been especially dramatic over the last week or so of trading. We have seen significant inflows quickly reignite, especially into growth-focused small- and mid-cap stocks:
This type of flow data reversal could have a significant positive impact heading into September. It has the potential to create a scenario where end-year market strength starts earlier than usual.
Perhaps the strongest fundamental reason for this earlier-than-expected market strength in both inflows and the 20-day moving average support lies in recent corporate earnings.
The reporting season is now almost finished, with 96% of S&P 500 companies having reported. Of those, 83% have beaten earnings and revenue expectations, which is well above the five-year blended average of 72%:
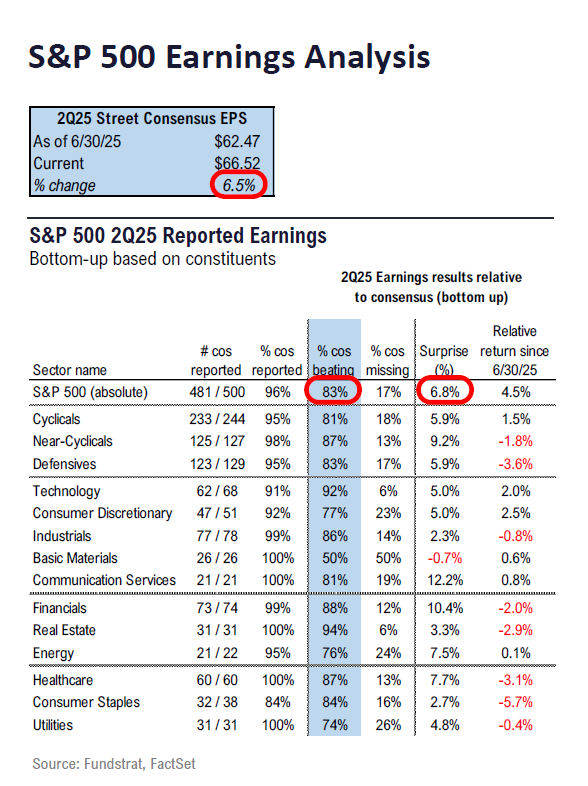
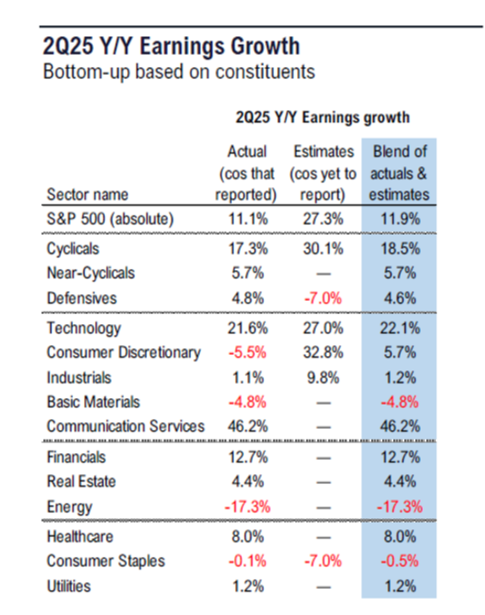
More importantly, earnings have grown 11.1%, which is the third straight quarter of double-digit gains:
This level of earnings momentum seems to be providing an increasingly sturdy foundation for the market.
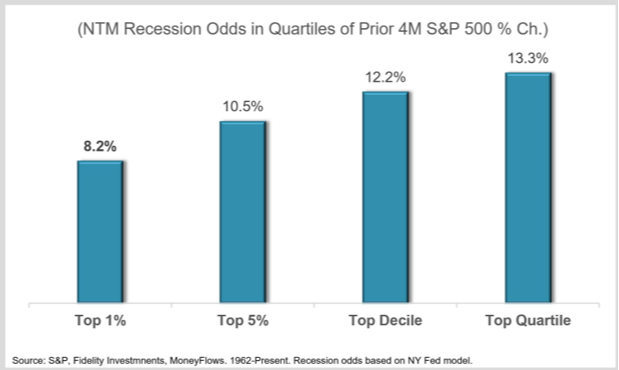
This current fundamental data seemingly supports what the market appears to be predicting moving forward. Historically when stocks rally sharply like they have in 2025, recession odds decrease.
The Federal Reserve Bank of New York’s recession model has historically shown declining risk in the year following market surges like we are experiencing. As you can see in the chart below, the odds of a recession are only 8% in years following top percentile rallies like we are in now:
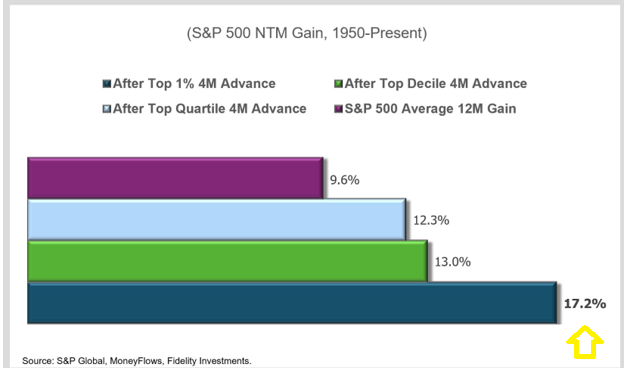
It seems that huge rallies like this are great for economic growth and stocks as they align with increasingly strong corporate earnings fundamentals. Historically, bigger rallies lead to better forward returns.
Statistically, increasing percentage jumps in the size of a rally like this should shift our attention away from worrying about what could go wrong and instead planning for what could go right. For example, top-percentile rallies like those taking place in 2025 have historically preceded 12-month gains of 17%, with positive returns 100% of the time:
For those continuing to pontificate that we've come too far, too fast, history and underlying corporate fundamentals would suggest the opposite.
* Links to third-party websites are being provided for informational purposes only. CoreCap is not affiliated with and does not endorse, authorize, or sponsor any of the listed websites or their respective sponsors. CoreCap is not responsible for the content of any third-party website or the collection or use of information regarding any websites users and/or members.
*Past performance does not guarantee future results.
* Investing involves risk and you may incur a profit or loss regardless of strategy selected.
* The S&P 500 is an unmanaged index of 500 widely held stocks that is generally considered representative of the U.S. stock market.
Securities sold through CoreCap Investments, LLC. Advisory services offered by CoreCap Advisors, LLC. Cornerstone Financial and CoreCap are separate and unaffiliated entities.