

We’re halfway through 2024, and in Cornerstone’s view, equities rose overall in June for the “right reasons” as inflation continued tracking softer than consensus expectations.
Additionally, more good inflation news for vehicles continues to come out. Inventories surged to pre-pandemic levels as production continued to improv and demand waned. In fact, Ford now has a 100 days’ supply on many dealer lots.

Ford isn’t alone. Thus, buyer incentives are back, and probabilities favor the beginning of a deflationary environment:
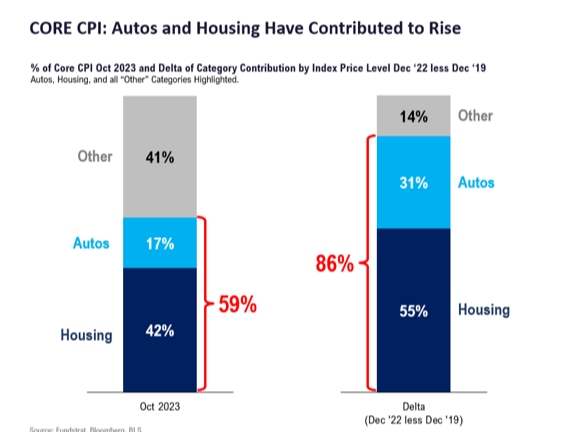
Vehicle price drops impact the consumer price index more than most people realize. Auto-related components comprise 17% of the core CPI and generated 31% of all core inflation since 2019:
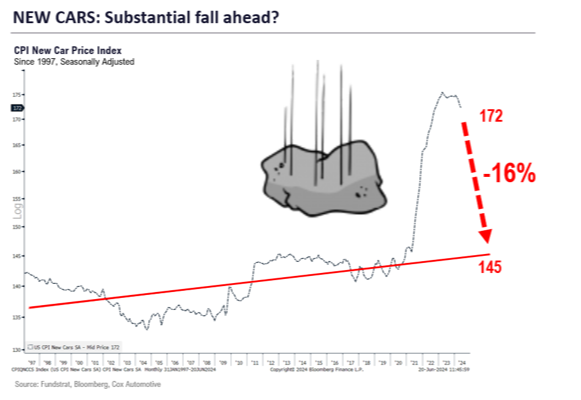
Looking forward, a fall in new vehicle prices to the 50-year trend would produce a 16% decrease from today's numbers:
It’s already happening with used vehicles. Prices are down almost 10% from their 2023 peak:
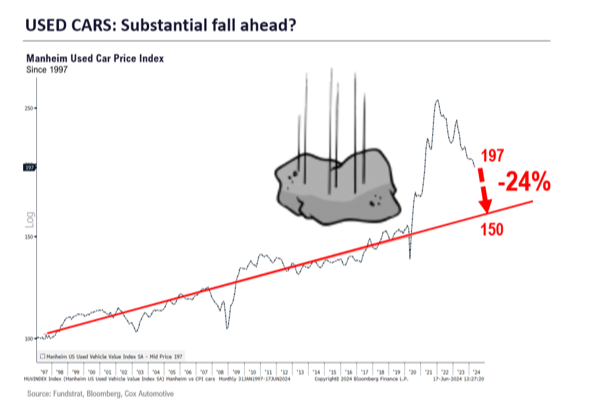
We think used vehicle prices could drop another 24% to return to the trendline. This all suggests the second-largest CPI component is set to see substantial deflation soon.
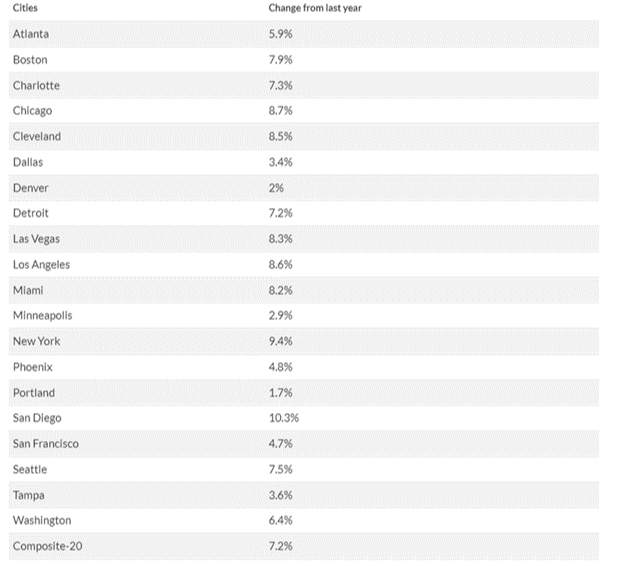
Turning to the other major inflation contributor – housing – last week brought April’s Case-Shiller home price data, which is important despite its lagging nature.
While the 7.2% figure remains elevated, it’s a decrease from March’s 7.5% and may be the beginning stage of significant housing price deceleration. As pundits suggest home prices are re-accelerating, the latest data shows that’s only true where there’s extremely tight inventory. It’s untrue in formerly hot markets like Phoenix, Denver, and many Florida cities:
While still early, this data provides cause for optimism in the second half of 2024. As such, we continue to be constructive on stocks, though expecting seasonal bumps.
Furthermore, we think the narrow-market-breadth argument is misplaced. Consider that 33% of the S&P 500* is up over 10% to date, and 8% of the index is up over 30%:
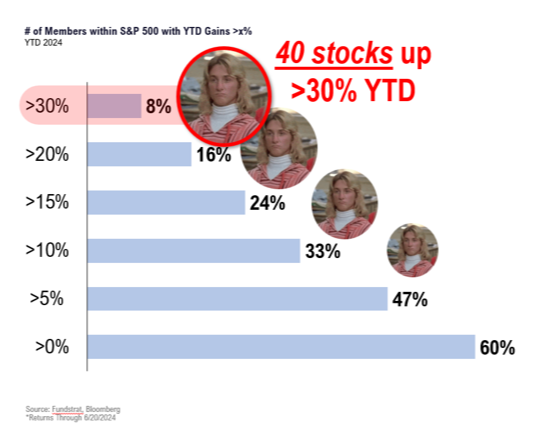
That means 40 S&P 500 stocks are up over 30% this year – hardly a narrow market commanded by just seven stocks as often espoused.
Everyone’s Favorite Stock and the “Emotional Tax”
Let’s examine the “stock du jour,” NVIDIA Corporation (NVDA)#. Despite it’s meteoric rise, it’s not the most owned holding by hedge funds:
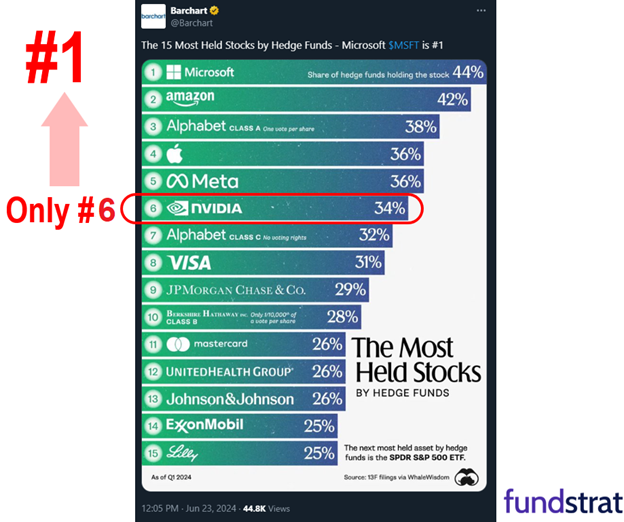
That’s surprising. NVDA is a high-flier and the largest stock by market capitalization. We think funds will keep buying dips until NVDA tops that list above.
Now let’s use NVDA and “big money” investor data to reinforce how patience and analytical thinking helps to avoid the “emotional tax” of investing (i.e., bad decision making due to emotion).
For many, NVDA is an important holding. That means it brings more dopamine rushes as people eye its every move. But that's impractical. And it could be depressing examining NVDA all day because it’s still a volatile stock, even after this rise.
For example, on June 20, NVDA fell 3.5%. The day prior, it rose 3.5%. That's a 7% swing in two trading sessions!
If you stopped watching NVDA on June 1, you would’ve missed a wild ride. The stock surged 19.3% from June 1-20, including the two-day 7% swing and peaking at a 23.7% gain. The daily average move for those trading sessions was 1.4%, which is $42 billion per day:
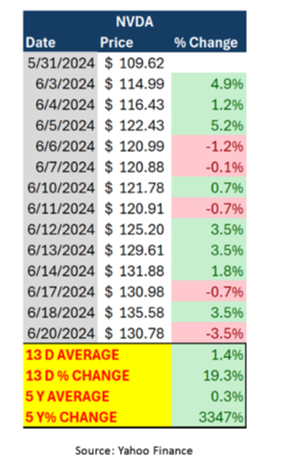
But with a time horizon of five years, the daily average move drops to just 0.3%, and the overall gain skyrockets to 3,347%.
Not all stocks are NVDA, yet this extreme example shows the importance of looking away to get the bigger picture. What if your preferred stock dropped 10% next week? Would it matter five years from now?
If NVDA holders fell prey to an emotional tax five years ago, they would’ve missed out on enormous gains. This is why we preach a stoic investing approach based on data and patience.
A Potential Shift
Nearing the end of June, we began to see a divergence where the market rose while MAPsignals’ trusty Big Money Index (BMI) sank:
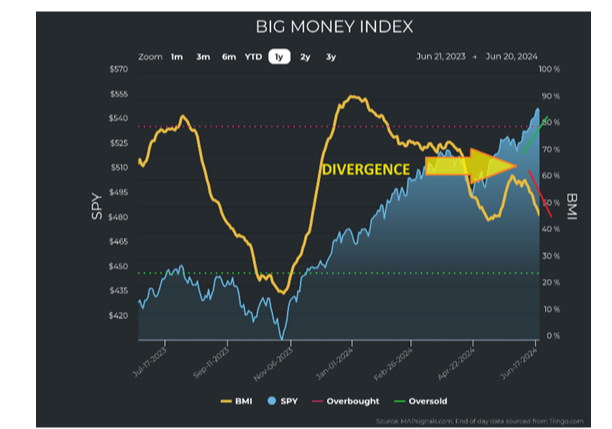
Remember, the BMI is a 25-day moving average of netted buys and sells from “big money” professional investors.
This made us wonder if there was reason for concern. “Big money” buying was shrinking, but so was selling. The tightening wedge meant accumulation and distribution were dwindling (summer doldrums?):
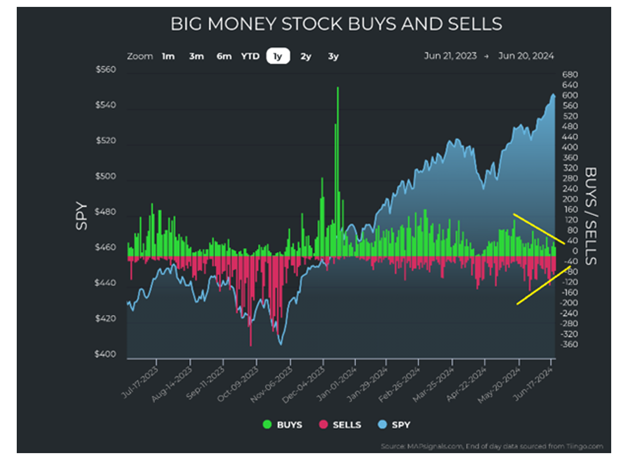
However, trading volumes stayed fairly consistent. As a result, we think it indicated a potential shift for several reasons.
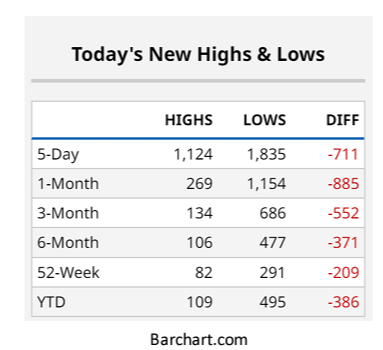
First, fewer stocks are making new highs while more are making new lows. The market is taking a breather after significant gains:
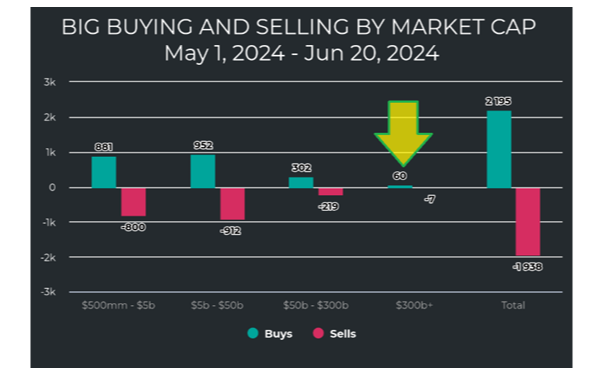
Second, the following chart shows the stocks hitting highs on big volume have been the huge ones. Again, this indicates a consolidation as we come to the midway point of the year.
Next, sector breadth is stagnant. Every sector other than technology began to move sideways at the end of June without much accumulation. Recent trading shows ups and downs, but mostly just choppiness.
The fourth reason we see a shift is many stocks moving below key technical levels. As the June-end breather unfolded, 64% of S&P 500 stocks fell below their 50-day moving averages while the index remained near all-time highs.
Finally, seasonality reinforces our view. It’s normal to expect a nice July followed by increased volatility in August, September, and early October:
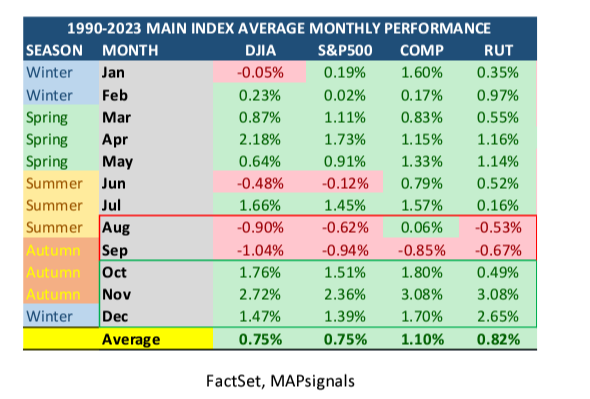
This all prepares us for the months ahead while reinforcing how the market is acting normally.
Zooming out, we see opportunities. While weaker breadth may feel like impending doom, it’s a rare gift. History shows the laggards should catch up in a big way.
Using the exchange-traded funds SPDR S&P 500 ETF Trust (SPY) and Invesco S&P 500 Equal Weight ETF (RSP) as proxies, we can see how when breadth quickly falls, the equal-weight S&P 500 outperforms the market-weighted index with a high win rate historically:
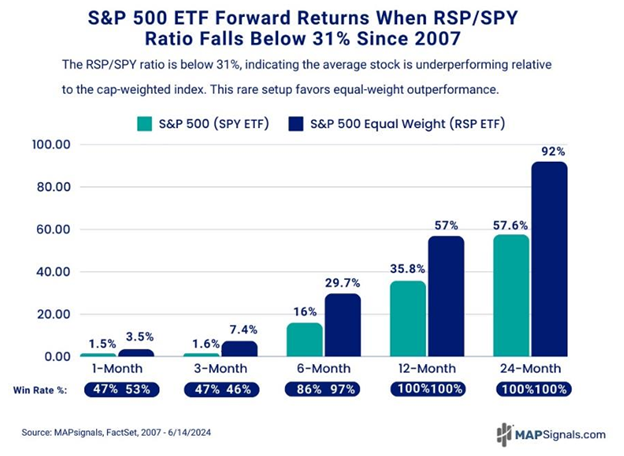
This setup forecasts a healthy rotational market. It appeared in our portfolio models, which are equally weighted, just like during 2023’s end and the start of 2024.
Remember, nervous energy and focusing on minutiae produces an emotional tax that only hurts over the long run. With clear heads, we can identify opportunities based on objective data, superior fundamentals, and institutional inflows.
* Links to third-party websites are being provided for informational purposes only. CoreCap is not affiliated with and does not endorse, authorize, or sponsor any of the listed websites or their respective sponsors. CoreCap is not responsible for the content of any third-party website or the collection or use of information regarding any websites users and/or members.
* The S&P 500 is an unmanaged index of 500 widely held stocks that is generally considered representative of the U.S. stock market.
# NVDA is owned in Cornerstone client accounts and by Daniel Milan personally.
Securities sold through CoreCap Investments, LLC. Advisory services offered by CoreCap Advisors, LLC. Cornerstone Financial and CoreCap are separate and unaffiliated entities.